Our Antique Dealer interactive map website has hit a momentous milestone this month – we now have more than 10,000 antique dealer shop locations in the map of Britain for the period 1900-2000 – there are 10,456 if one includes dealers with branches of their businesses in the USA and elsewhere in the world. Here’s the link to the MAP website if you want take a look antiquedealers.leeds.ac.uk
The map is still very much a work in progress and there are many more dealers to add, but we’ve been concentrating on adding dealers for the period from 1900 to c.1970 – when I say ‘we’, recently it’s actually just been me…..indeed, adding dealers to the map during the Corona Virus Lockdown has been a really mind-soothing job. I guess I’ve added more than 3,500 over the past few months. It’s been detailed, repetitive work, but it’s also been truly fascinating seeing the map evolve and change as more and more antique dealers are added. And with so many dealers in the map you can now begin to see the changing spacial geography of the trade emerge.
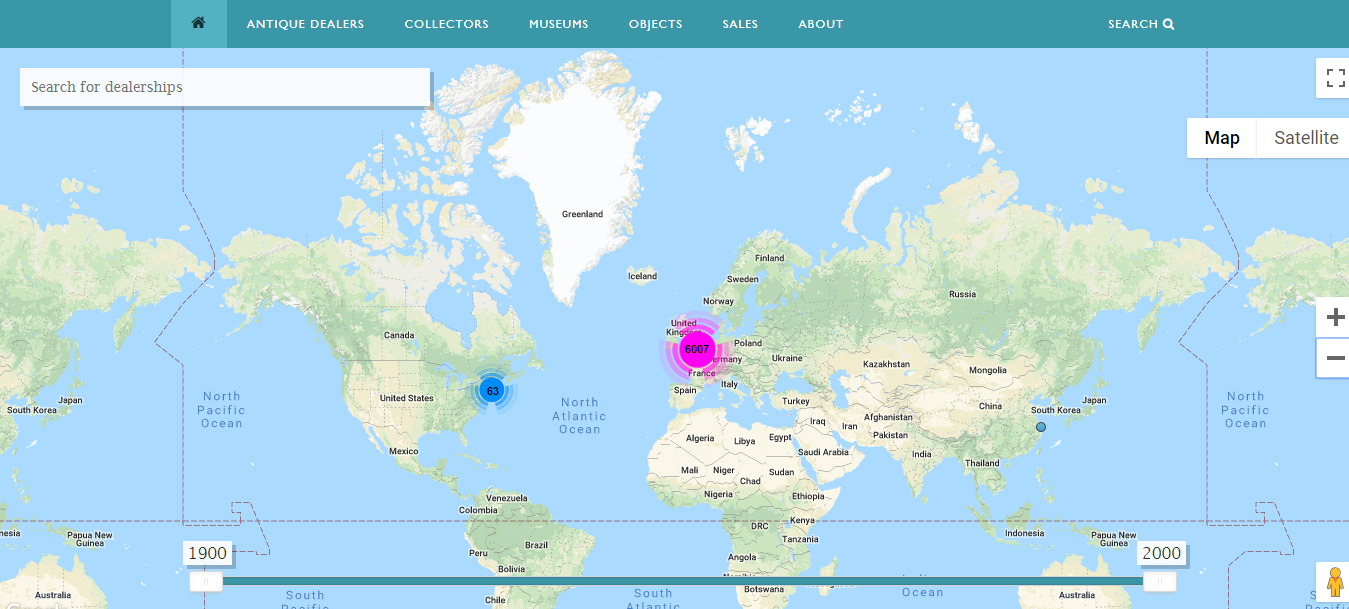
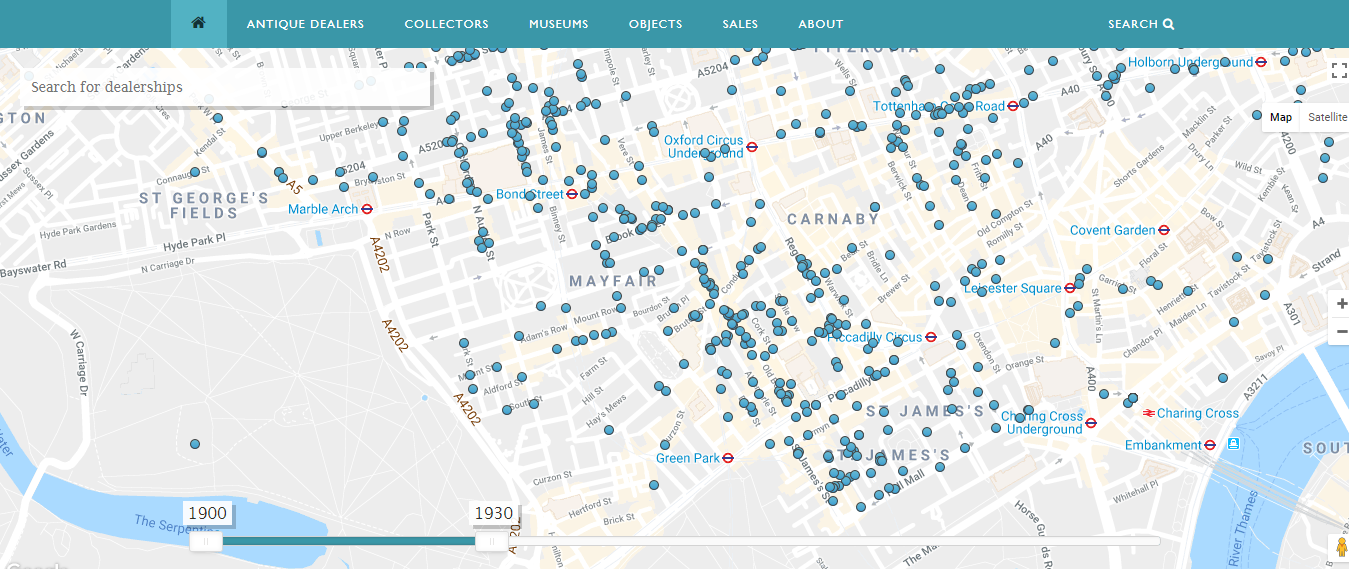
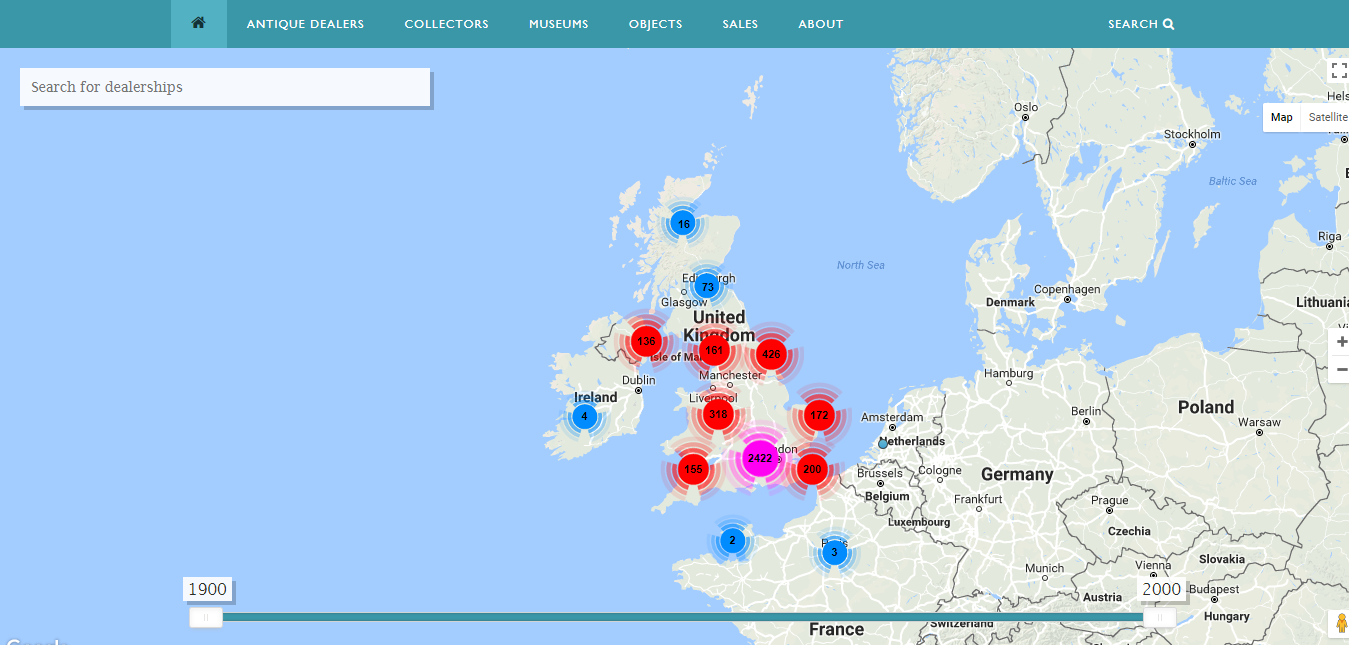
I can share some preliminary insights with you, through the amazing technology of screen-capture! Here, for example (below), is the bird’s eye view of the clusters of total numbers of antique dealers in Britain in the period 1900-1930 – the colour of the dots indicates the concentration of dealers in an area – blue for lower numbers, red for higher numbers, pink for highest concentration.
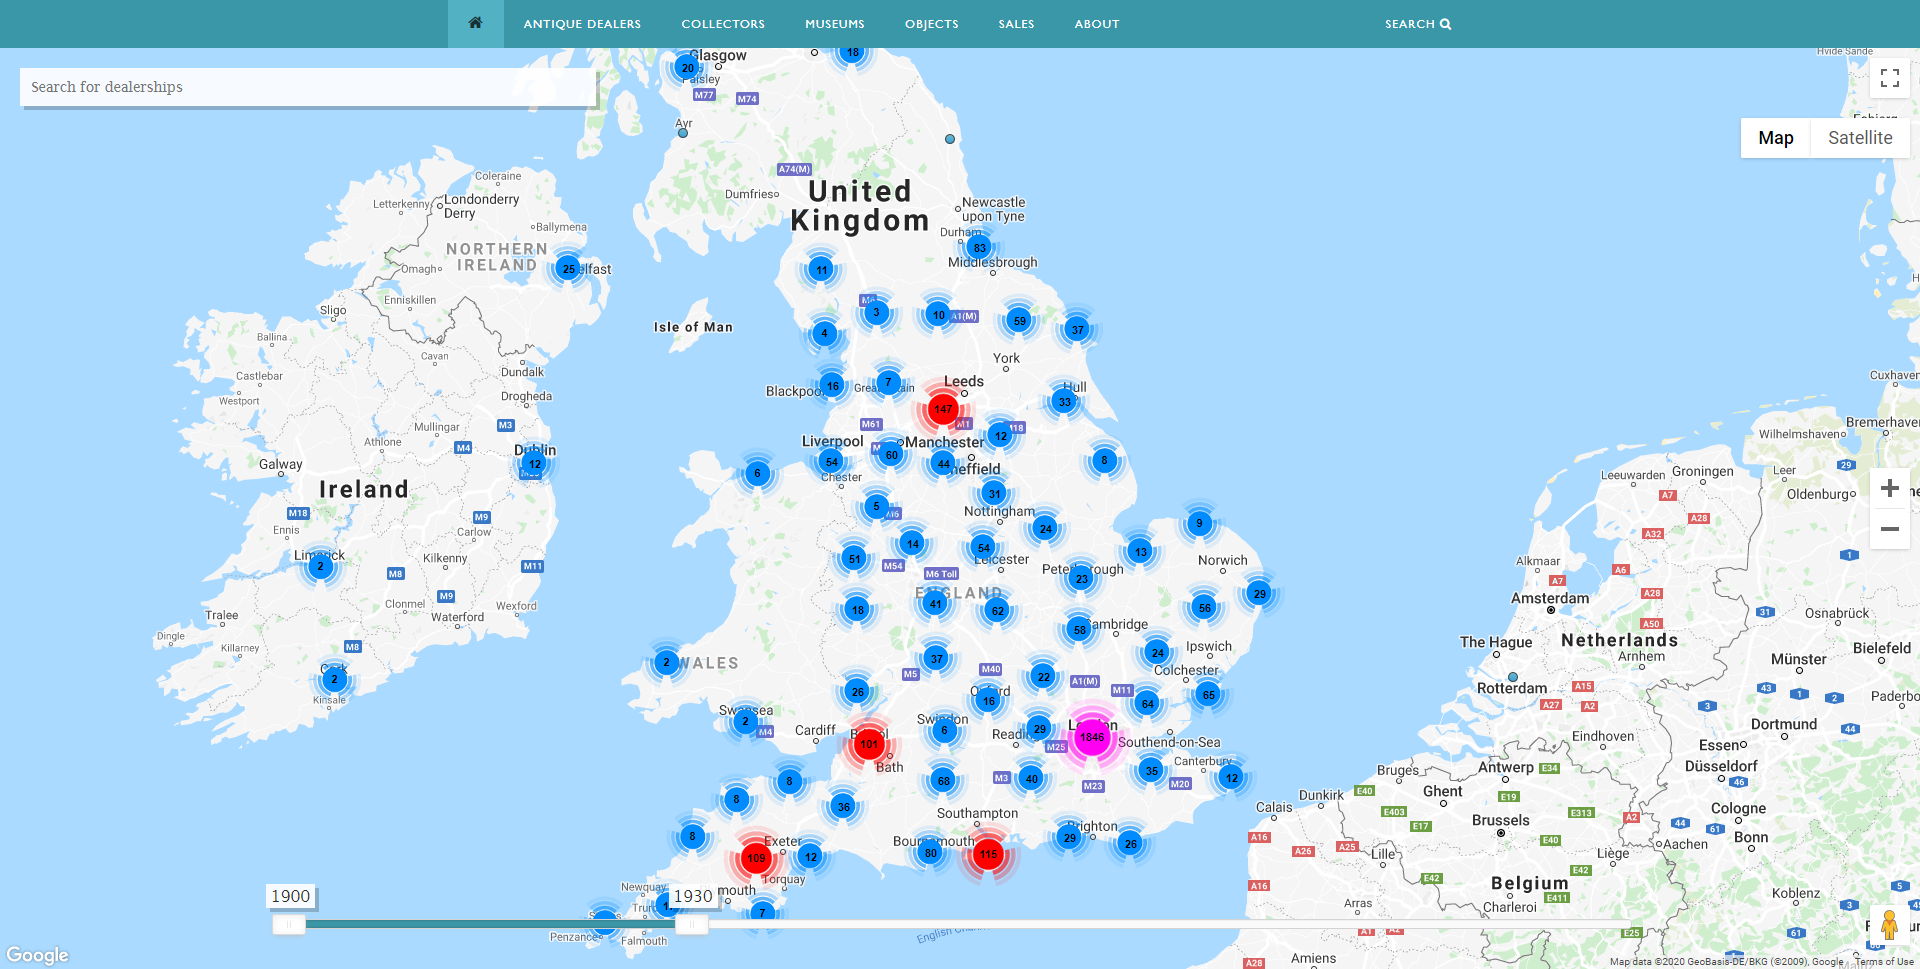
Antique Dealers Map showing dealers in Britain 1900-1930. Image, Antique Dealers Project, University of Leeds.
As you can see (above), there are clusters of dealers in various regions and cities and towns across Britain in 1930, but several areas are worthy of note and can be compared with the same visual representation in the screen shot of dealers in Britain in the Map in the period 1900-2000 (below). One thing that emerges in the 1930 map (above) is that London has by far the largest concentration of antique dealers (1,846 in 1930); one can also note the number of dealers on the South Coast – Bournemouth area has 80 dealers and the Portsmouth area 115 dealers in 1930. To the west, the Exeter area has 109 dealers; and Bath/Bristol has 101 dealers in the same period. If one moves North, one can see that Leeds and surrounding locations (which would include Harrogate and York in this map view) have 147; the North East of England has 83 dealers. Note however, the area around Sussex and Hampshire border, to the south west of London, which has 40 dealers in 1930; and note around Brighton and the South Sussex coast, which has c.50 dealers.
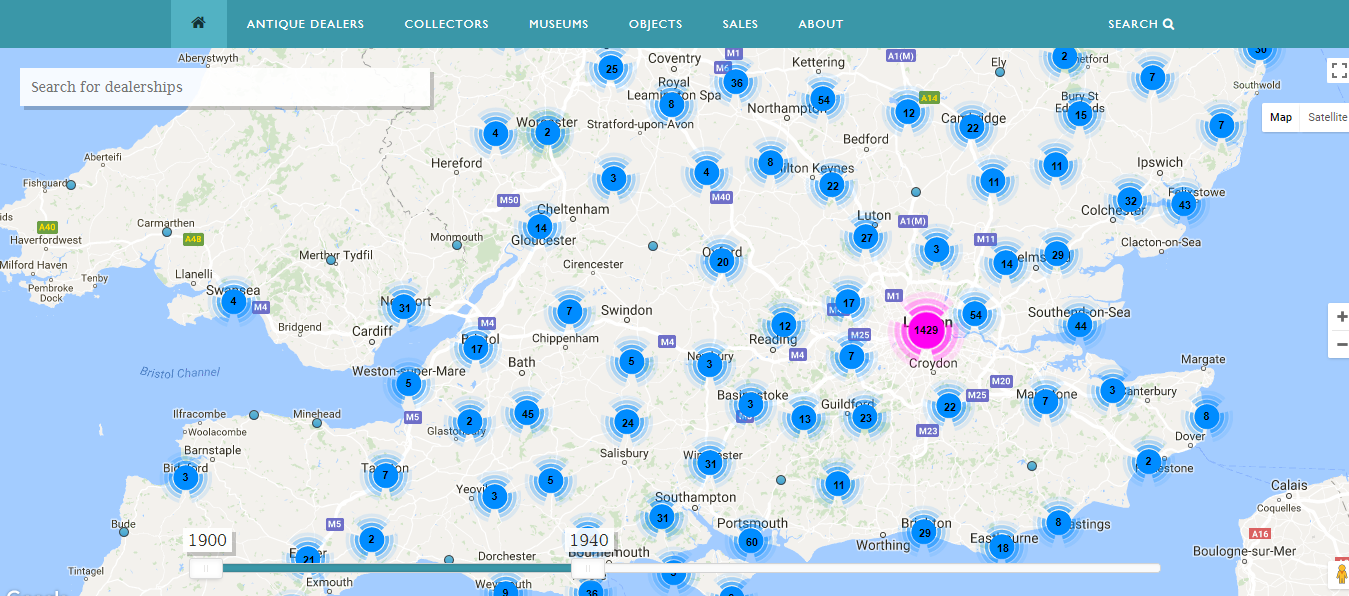
In the screen shot of the same map showing dealers 1900-2000 (below) – (note however that the map will be mainly concentrating on dealers dating from up to c.1970) – one can see some striking developments in the changing geography of the antique trade.
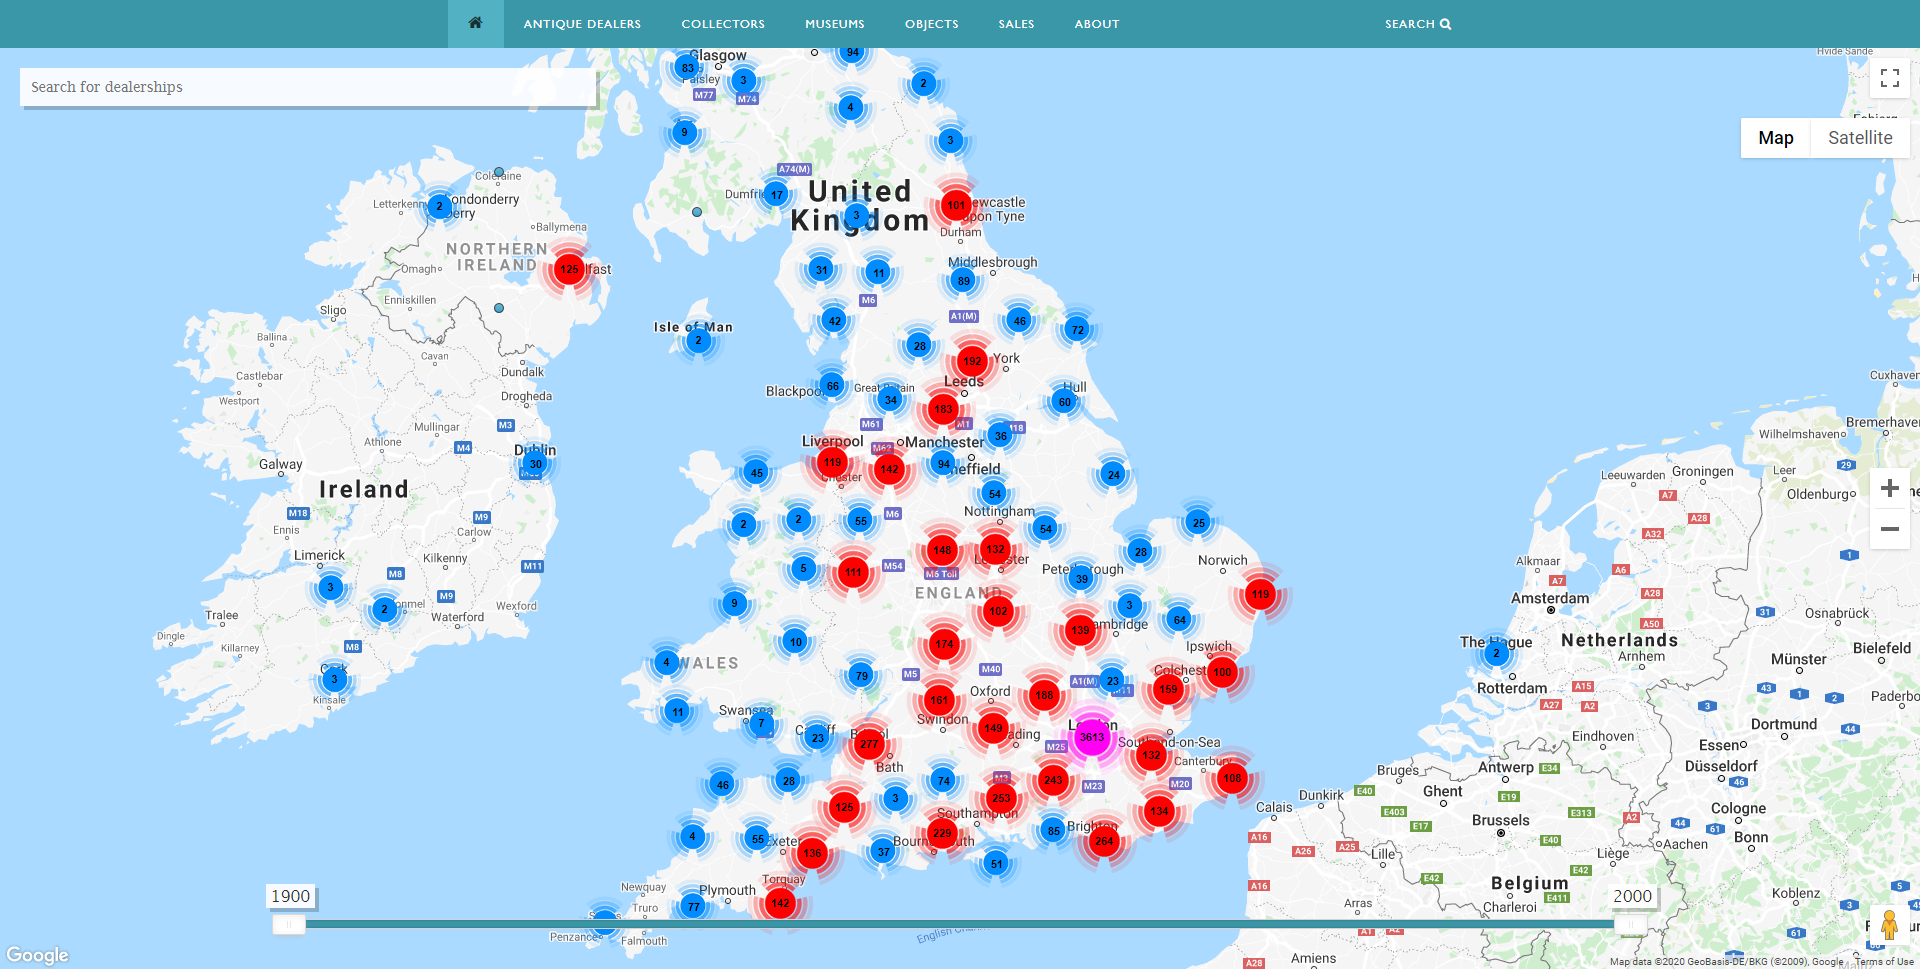
Antique Dealers Map showing dealers in Britain 1900-2000. Image, Antique Dealers project, University of Leeds.
In the view (above), the number of antique dealers has increased enormously across all areas of Britain since 1930. The numbers of dealers in London alone has grown to more than 3,600 by c.1970; the Brighton area has also expanded considerably to 264 dealers (from c.50 in 1930). The Bournemouth area (including Portsmouth) has gained steady growth, and now has c.300 dealers (in c.1930 the area had c.200 dealers); the number of dealers in the Exeter and Torquay area has expanded to c.140 in each location (increasing from c.120 to c.300 for the area over the period). There has also been an increase in the number of dealers in Bath and Bristol, rising from 101 to 277. The Leeds area, including Harrogate and York, has expanded to c.400 dealers, doubling in size since c.1930. The North East, by contrast, has gained a much smaller percentage, expanding from 83 dealers in 1930 to c.100 dealers by c.1970. What is really striking however, is the expansion of dealers around Hampshire/Sussex area – here the numbers of dealers has grown exponentially from just 40 dealers in 1930, to 243 dealers by c.1970. Indeed, the whole area of the South East has seen the largest increase in the numbers of dealers, with not just the larger satellite towns around London seeing an increase in dealers, but dozens of smaller villages in the ‘Home Counties’ (those counties surrounding London such as Berkshire, Sussex, Essex, Kent etc) attracting antique dealers.
This change is itself a symptom of the expanding market for antiques in the Post World War II era, but also a consequence of the development of increasing numbers of amateur collectors opening antiques shops in the 1950s and 1960s – a development that had particular effect in and around London and the South and South East. One other thing to note (although not illustrated in the map) is that during the 1950s and 1960s there was also a significant increase in the number of antique shops that were called ‘Ye Olde’ or some other generic name, rather than being named after the owner of the person that owned the business – so, for example, by the late 1960s there are dozens of shops called ‘Old Bakehouse Antiques’ or ‘Old Malthouse Antiques’, or ‘Cottage Antiques’; there is also a new development in quaint names for antique shops – ‘Old Things’, ‘Quaint Conceit’, ‘Year Dot’, ‘The Shambles’ etc. These developments, which seem to be concentrated in the ‘Home Counties’ also appear to be the result of the increasing presence of former amateur collectors entering the antique trade during the 1950s and 1960s.
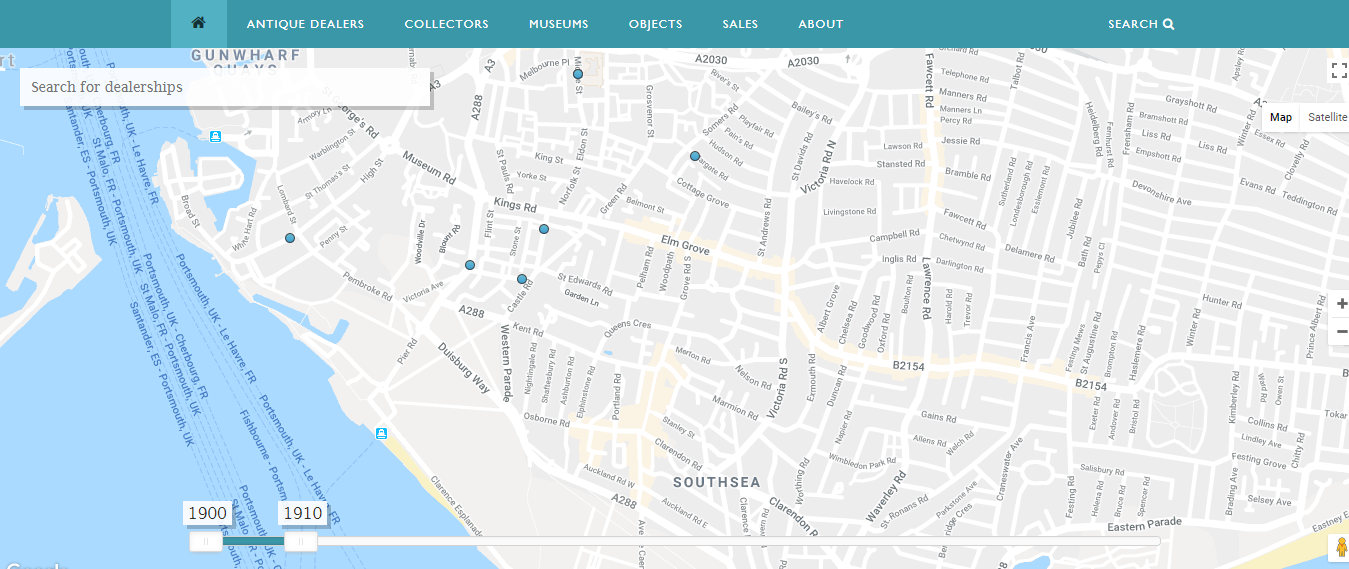
We can see more granulation in the results by focusing in further on some discrete locations and exploring the changing landscape of the antique trade at regional and county levels. Here, for example (below) is the birds eye view of the numbers of antique dealers in the South Coast of England in 1930.
Antique Dealers Map – showing dealer location on South Coast of England 1900-1930. Image, Antique Dealers research project, University of Leeds.
In this map (above), which gives a closer view of the South Coast, we can see that the town of Brighton had 18 dealers in 1930; Eastbourne had 13 dealers; Sevenoaks had 8 dealers; Tunbridge Wells had 7 dealers; Maidstone, 5 dealers; Winchester, which was a very popular location for dealers in the opening decades of the 20th century, had 30 dealers. Portsmouth has c.50 dealers and Southampton c.25 dealers. There are also a few towns dotted across the South East with just a single dealer (represented by a small blue dot), but most towns, if they had any dealers at all, only had 2 or 3 antique dealers.
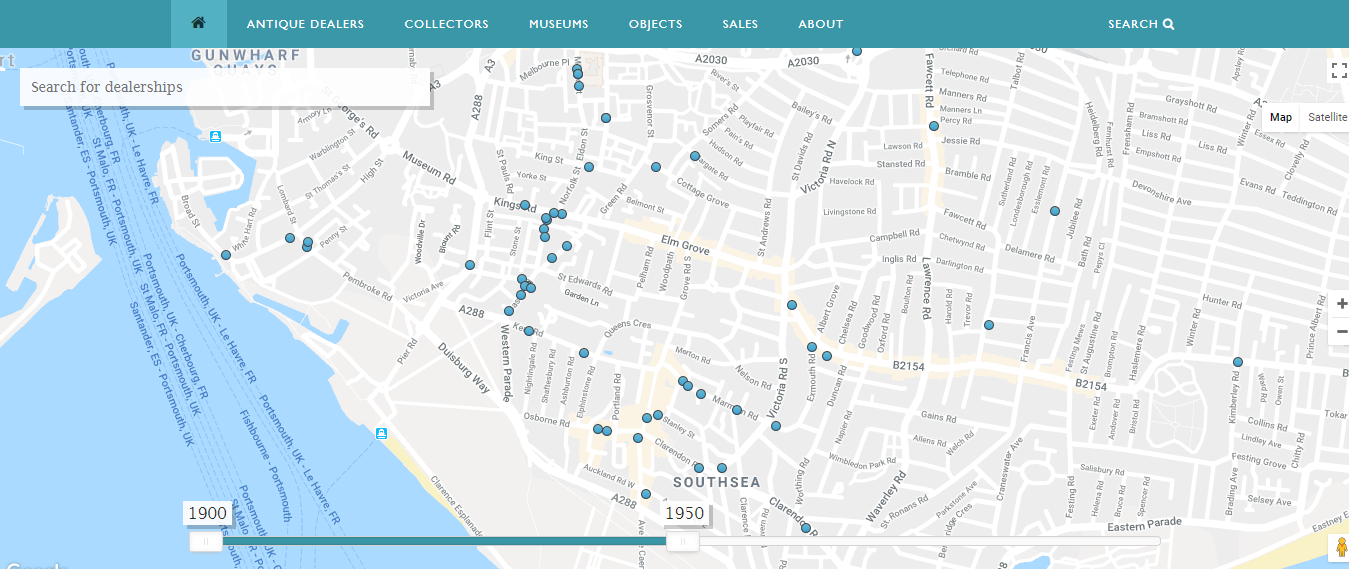
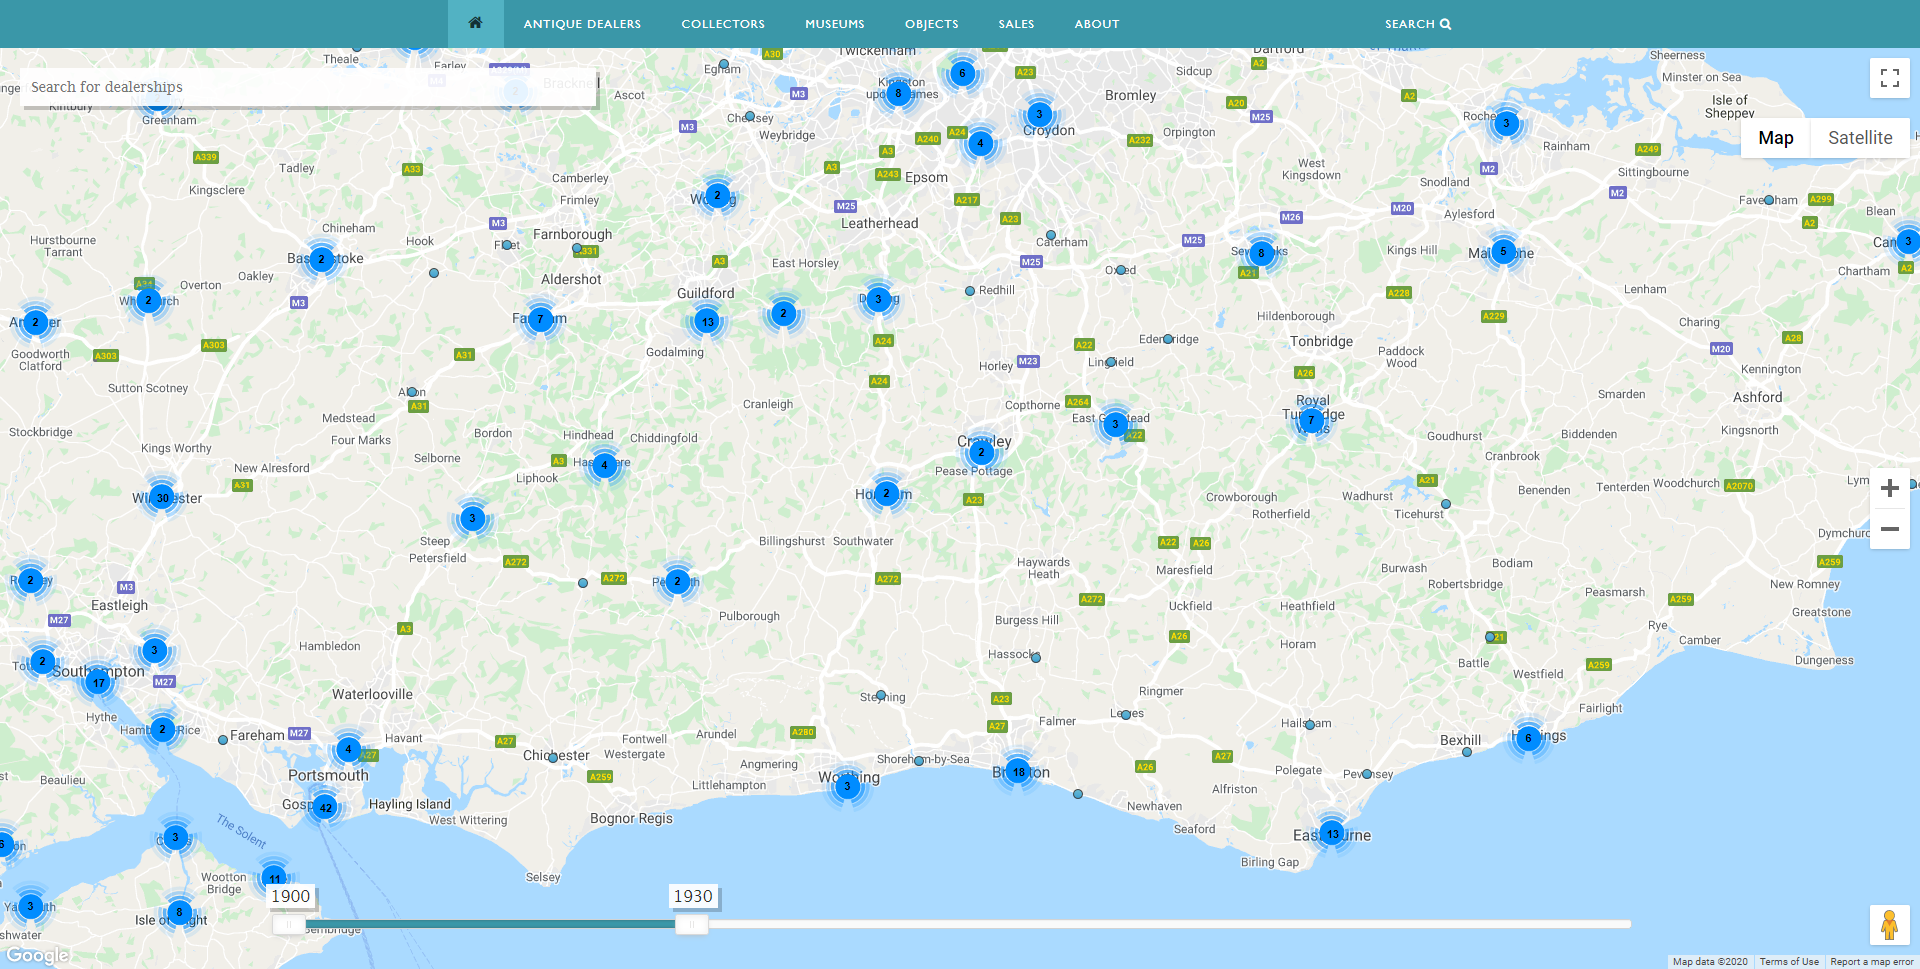
If we explore the South Coast map in the period 1900-2000 (see below) (and which, as I say, concentrates on the period up to c.1970) we can see the scale of the change in the region between 1930 and c.1970.
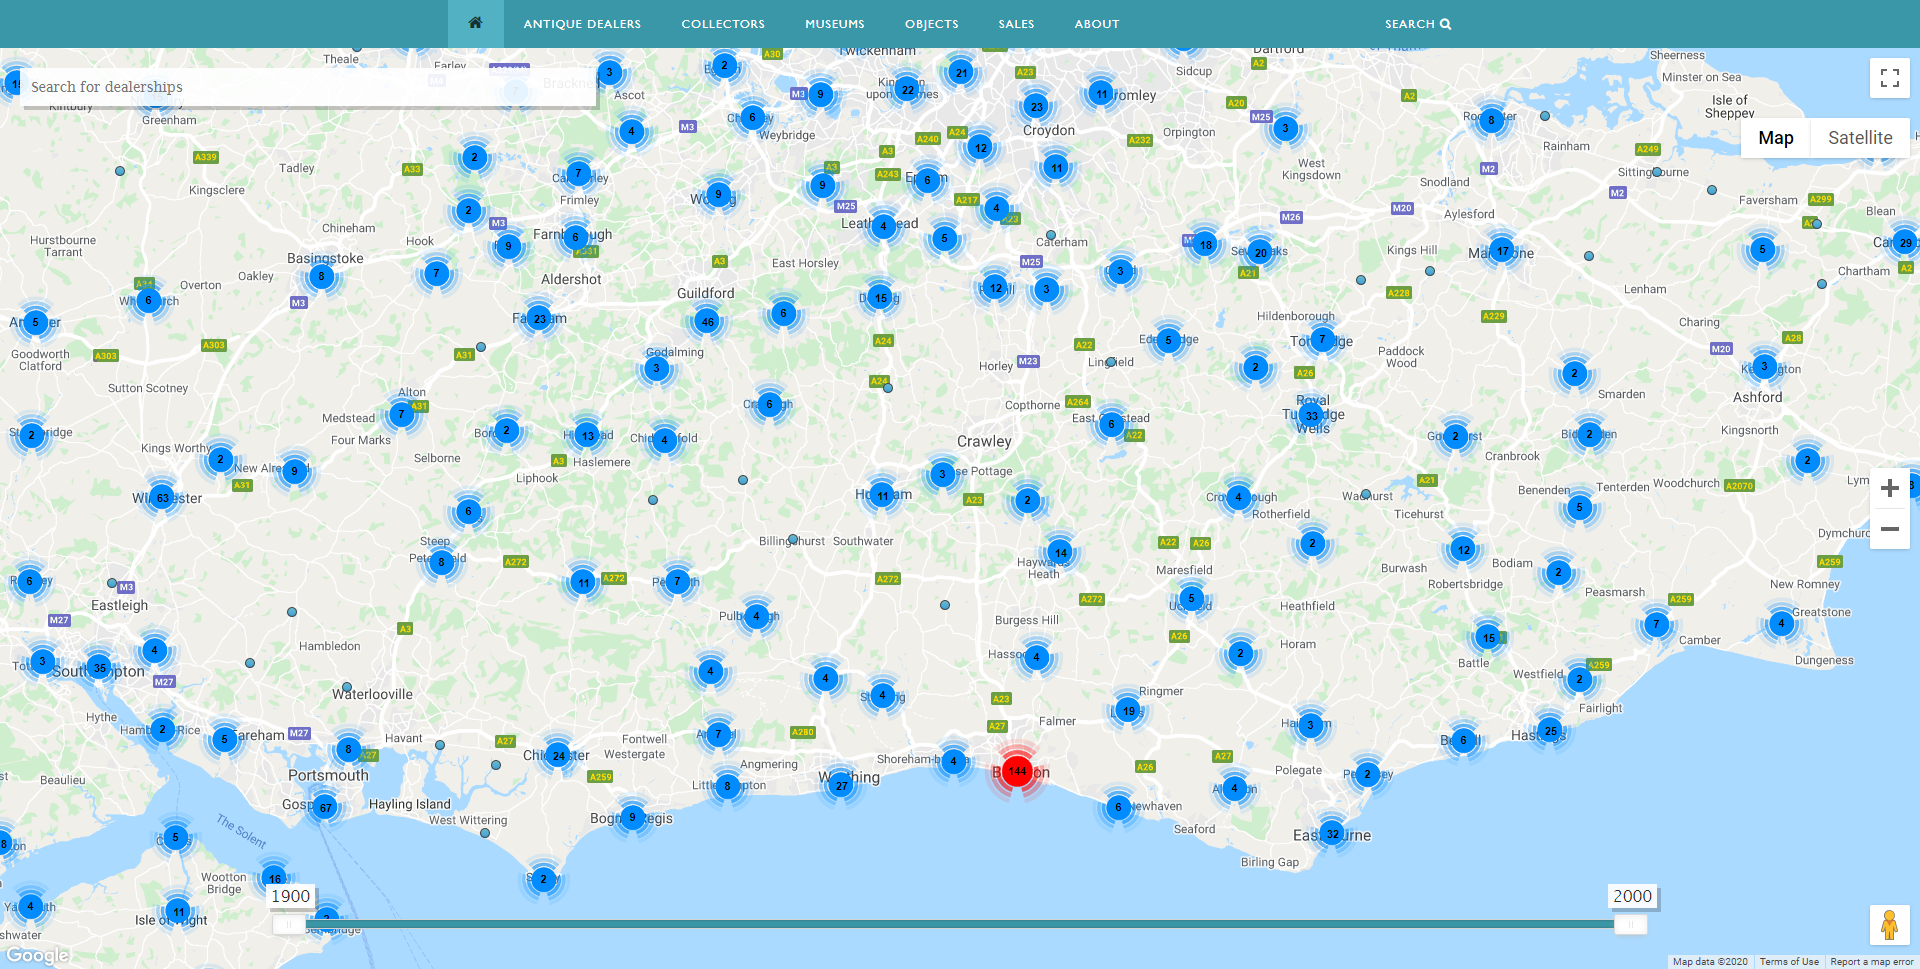
Antique Dealers Map – showing number of dealers on South Coats of England 1900-2000. Image, Antique Dealers research project, University of Leeds.
In this view (above), the number of dealers in Brighton has expanded to 144 (from just 18 dealers in 1930); Eastbourne now has 32 dealers; Sevenoaks has 20 dealers; Tunbridge Wells has attracted 33 dealers; Maidstone has 17 dealers. But even Winchester, which had comparatively high concentration of antique dealers even in 1930 (30 dealers) has more than doubled in size to 63 dealers. Portsmouth has also expanded to 75 dealers and Southampton has increased too, rising from 25 dealers to 45 dealers. But the real growth can be seen in the large numbers of dealers in the smaller satellite towns around the South East, each of which has expanded the numbers of dealers – and many towns now boasting 10 or more antique dealers.
Below is another section of the map, this time a bird’s eye views of the South West of England – with the counties of Somerset and Devon – this view is of the area showing the number of antique dealers in 1930.
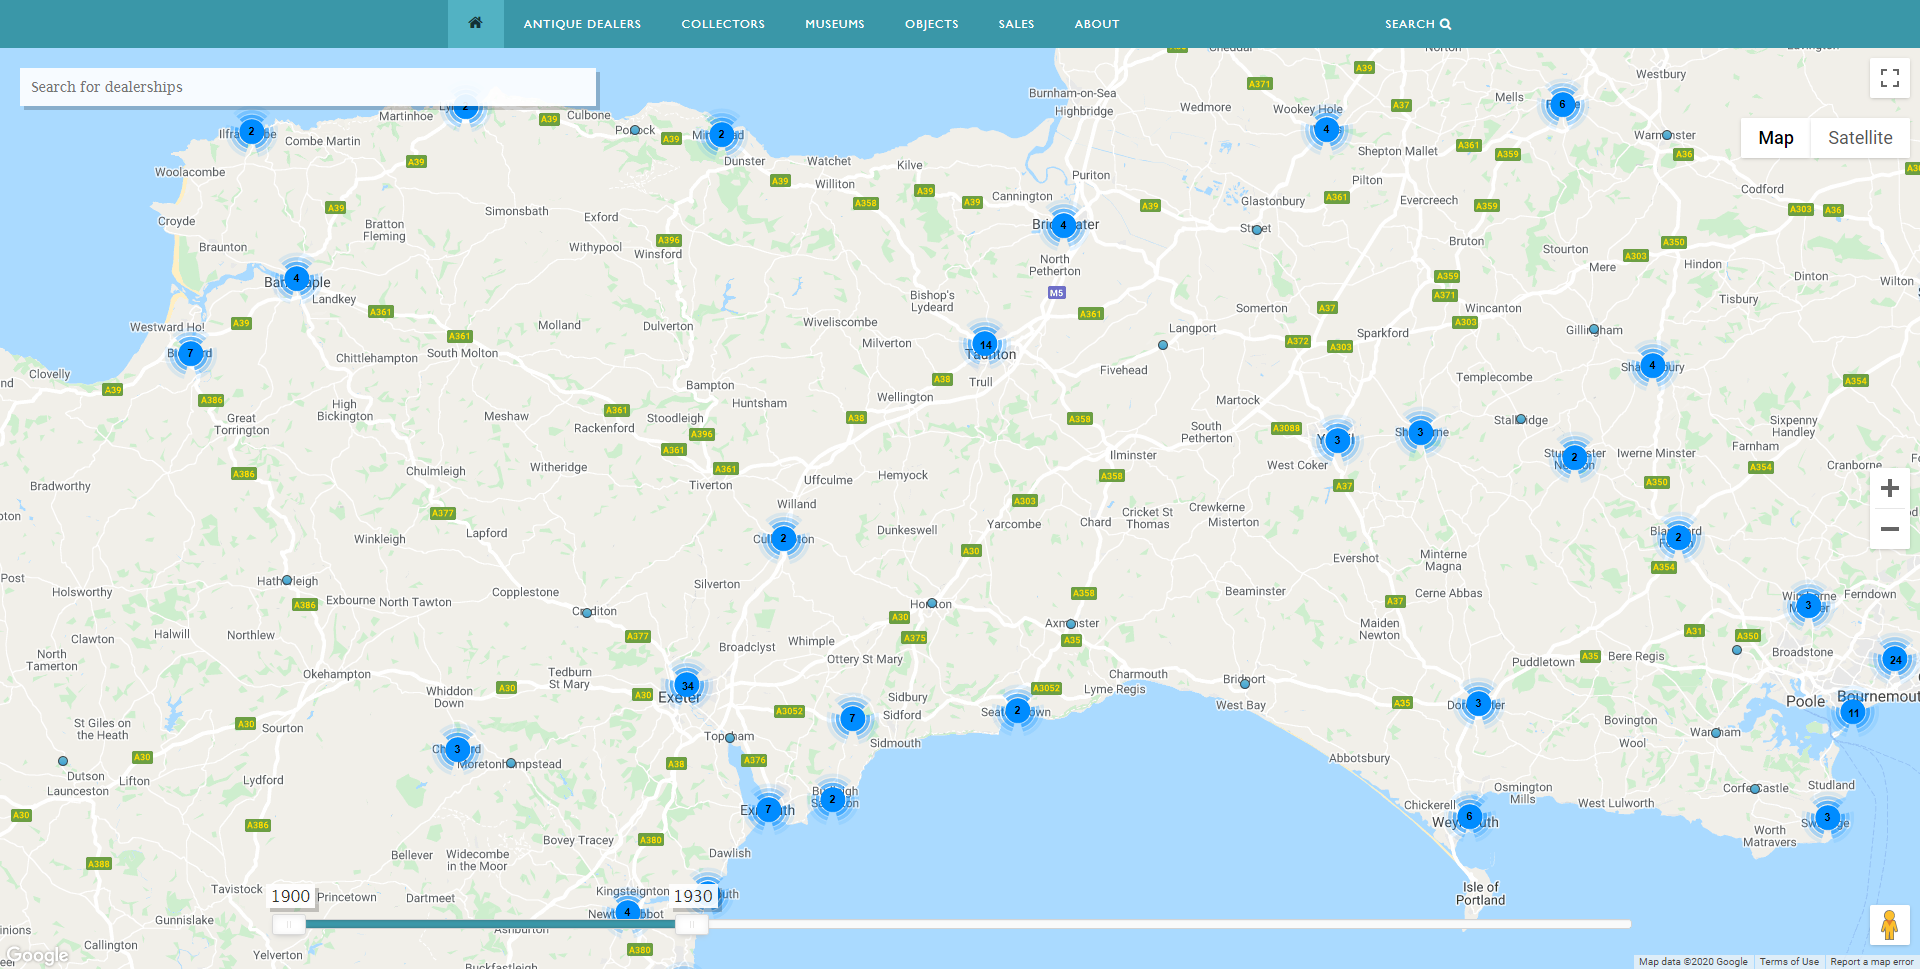
Antique Dealers Map – showing number of dealers in Devon and Somerset 1900-1930. Image, Antiques Dealers research project, University of Leeds.
In this view (above), The city of Exeter, which was an attractive location for antique dealers due to it’s historic architectural fabric and as a centre for tourism, has 34 dealers; Taunton, the County Town of Somerset, has 14 dealers. On the North Devon coast, Bideford has 7 dealers and several of the other coastal towns have a quite a few dealers even by 1930.
If we explore the same Devon and Somerset locations in the period 1900-2000 (see below) – (but up to c.1970, as I say) we can again see the changes to the geography of the trade.
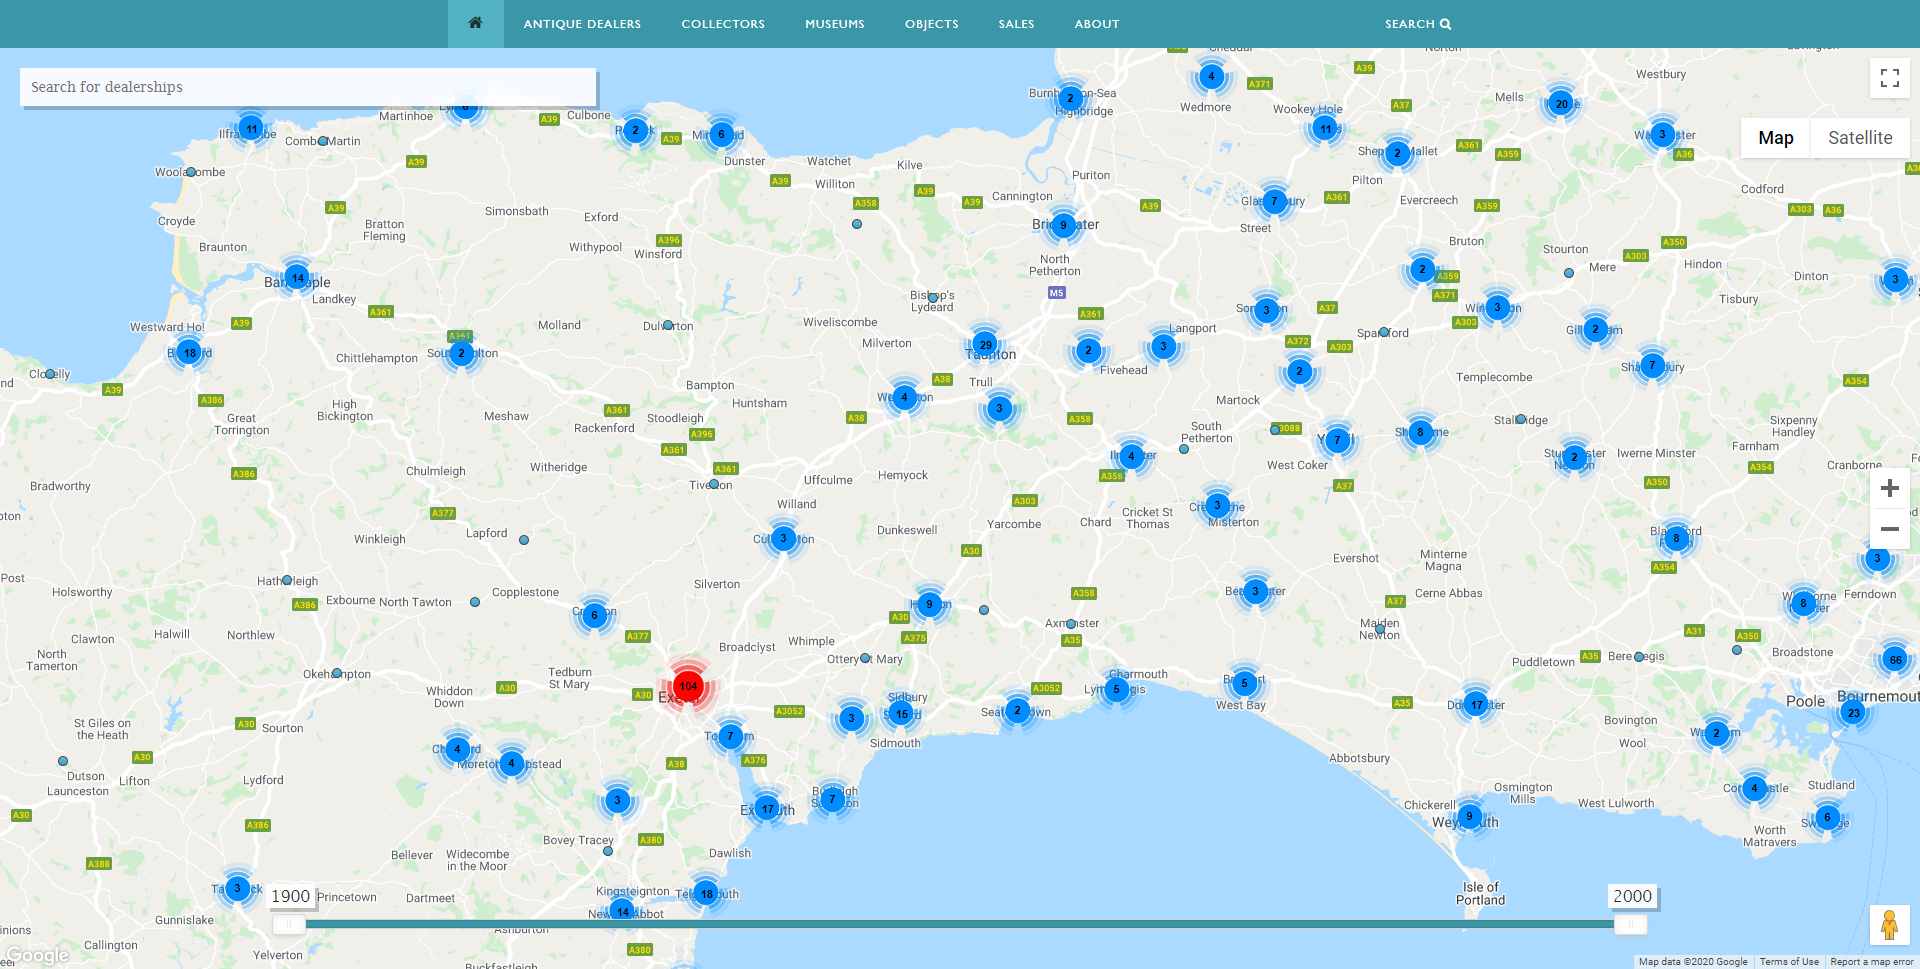
Antique Dealer Map, showing dealer locations in Devon and Somerset 1900-2000. Image, Antique Dealers research project, University of Leeds.
Here (above), the number of antique dealers in Exeter has expanded to 104 from 34; Taunton now has 29 dealers; Bideford has 18 dealers; Barnstaple 14 dealers. But there is also striking growth in the number of dealers across all the county towns as well, and an increasing number of small villages have also been chosen as key locations for antique shops (represented by the small, single blue dots on the map). This expansion was itself a symptom of the influence of tourism, but also of the regular (weekly) buying trips to the West Country made by the London and South East antiques trade.
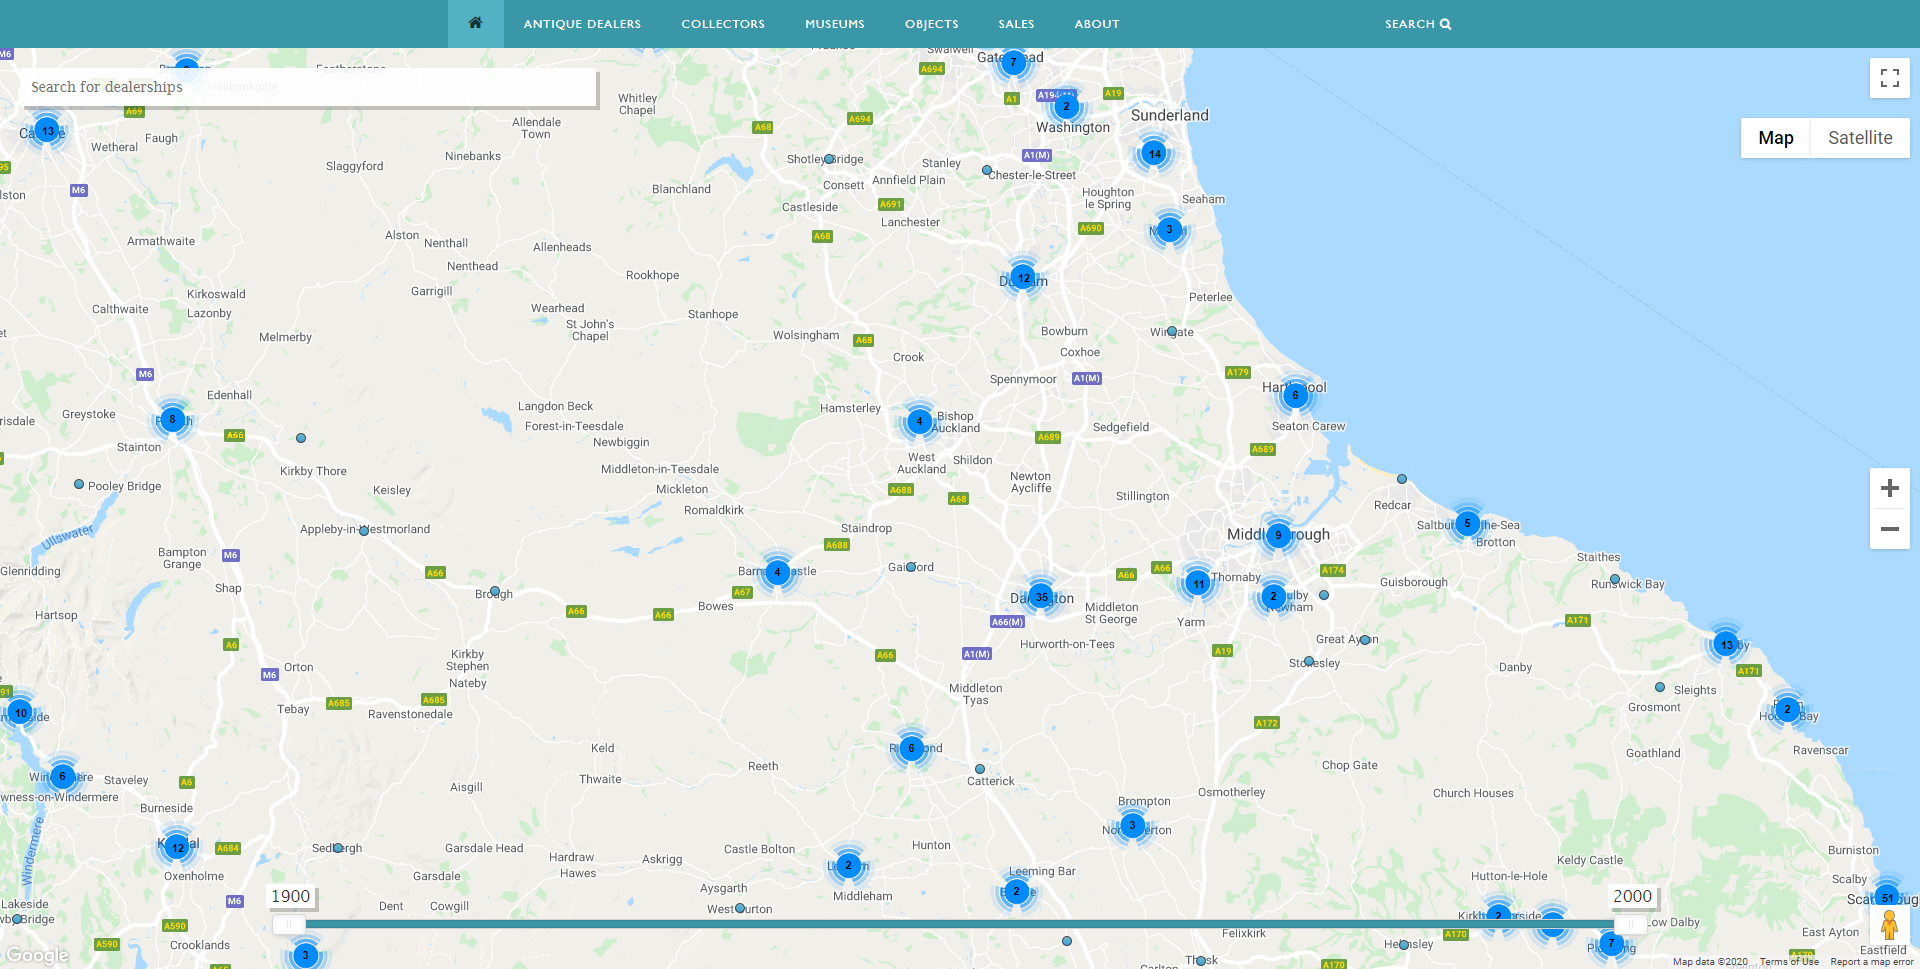
But what of the North East of England, an area often seen as being far removed from the tourist hotspots of the West Country and the South Coast of England? Below is a screen shot of the map for the North East:
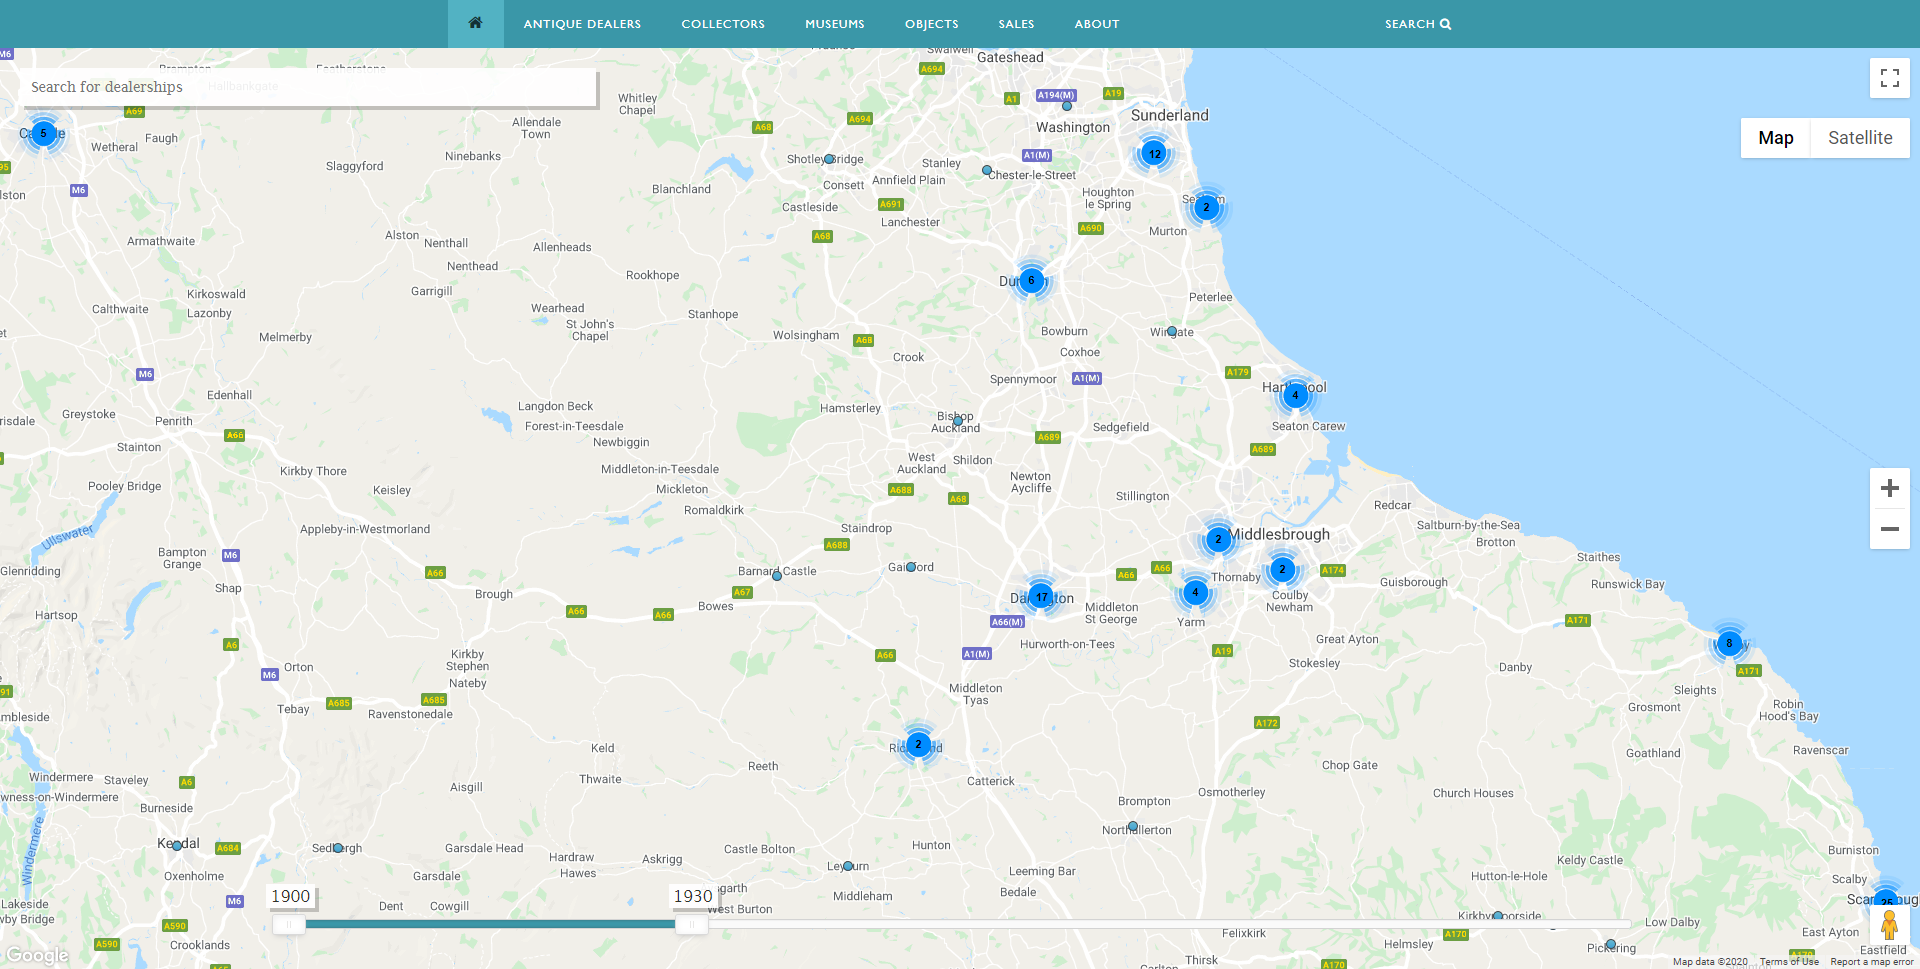
Antique Dealers Map – showing number of dealers in the North East of England 1900-1930. Image, Antique Dealers research project, University of Leeds.
We can note (above), that there were in fact quite a number of dealers in the North East in the period 1900-1930 – there were, of course, some very wealthy individuals in the North East, with fortunes built on Shipbuilding and industrial production – so it’s not really surprising that towns like Darlington already had 17 antique dealers by 1930; or that the area around Sunderland had 14 dealers. Durham, a historic city like Exeter, by contrast, only had 6 antique dealers in 1930. Scarborough was a particular hot-spot though, with 25 antique dealers by 1930. One can also note the small number of towns with just a single dealer (see Kendal, Barnard Castle, Leyburn etc).
Compare this (below) to the map showing the number of dealers in the North East of England in 1900-2000 (mainly up to c.1970, as I say):
Antique Dealers Map – showing number of dealers in North East England 1900-2000. Image, Antique Dealers research project, University of Leeds.
In the map (above) of the North East of England, the number of dealers in various locations has increased significantly, but nothing like the expansion seen in the South and the South East of England. In the North East, for example, Darlington, has seen the number of dealers increase from 17 to 35. But in the Sunderland area, there are c.15 dealers, which was about the same as it was in 1930. In Durham, there were now 12 antique dealers (up from 6 in 1930). Scarborough has seen a significant increase though, with 61 dealers by c.1970, up from 25 in 1930. Carlisle had 5 dealers in 1930, but has expanded to 13 dealers by c.1970. But perhaps the greatest change is in the numbers of antique dealers in the smaller, tourism driven towns, such as Kendal (which had just 1 dealer in 1930 and now boasts 12 dealers), and in towns like Ambleside (0 dealers in 1930, but 10 dealers by c.1970); and Penrith (0 dealers in 1930, but 8 dealers by c.1970).
In North Yorkshire, inland from the coastal town of Scarborough, there were already a number of locations long associated with the antiques trade, as this section of the map (below) of the number of dealers in the are in 1930 illustrates. Here, Harrogate (with 44 dealers) and York (with 45 dealers), as well as Leeds (with c.45 dealers) dominate the landscape in 1930. But there are also a small number of antique dealers in Knaresborough (9), in Bradford (9 dealers) and Halifax (9 dealers) by 1930.
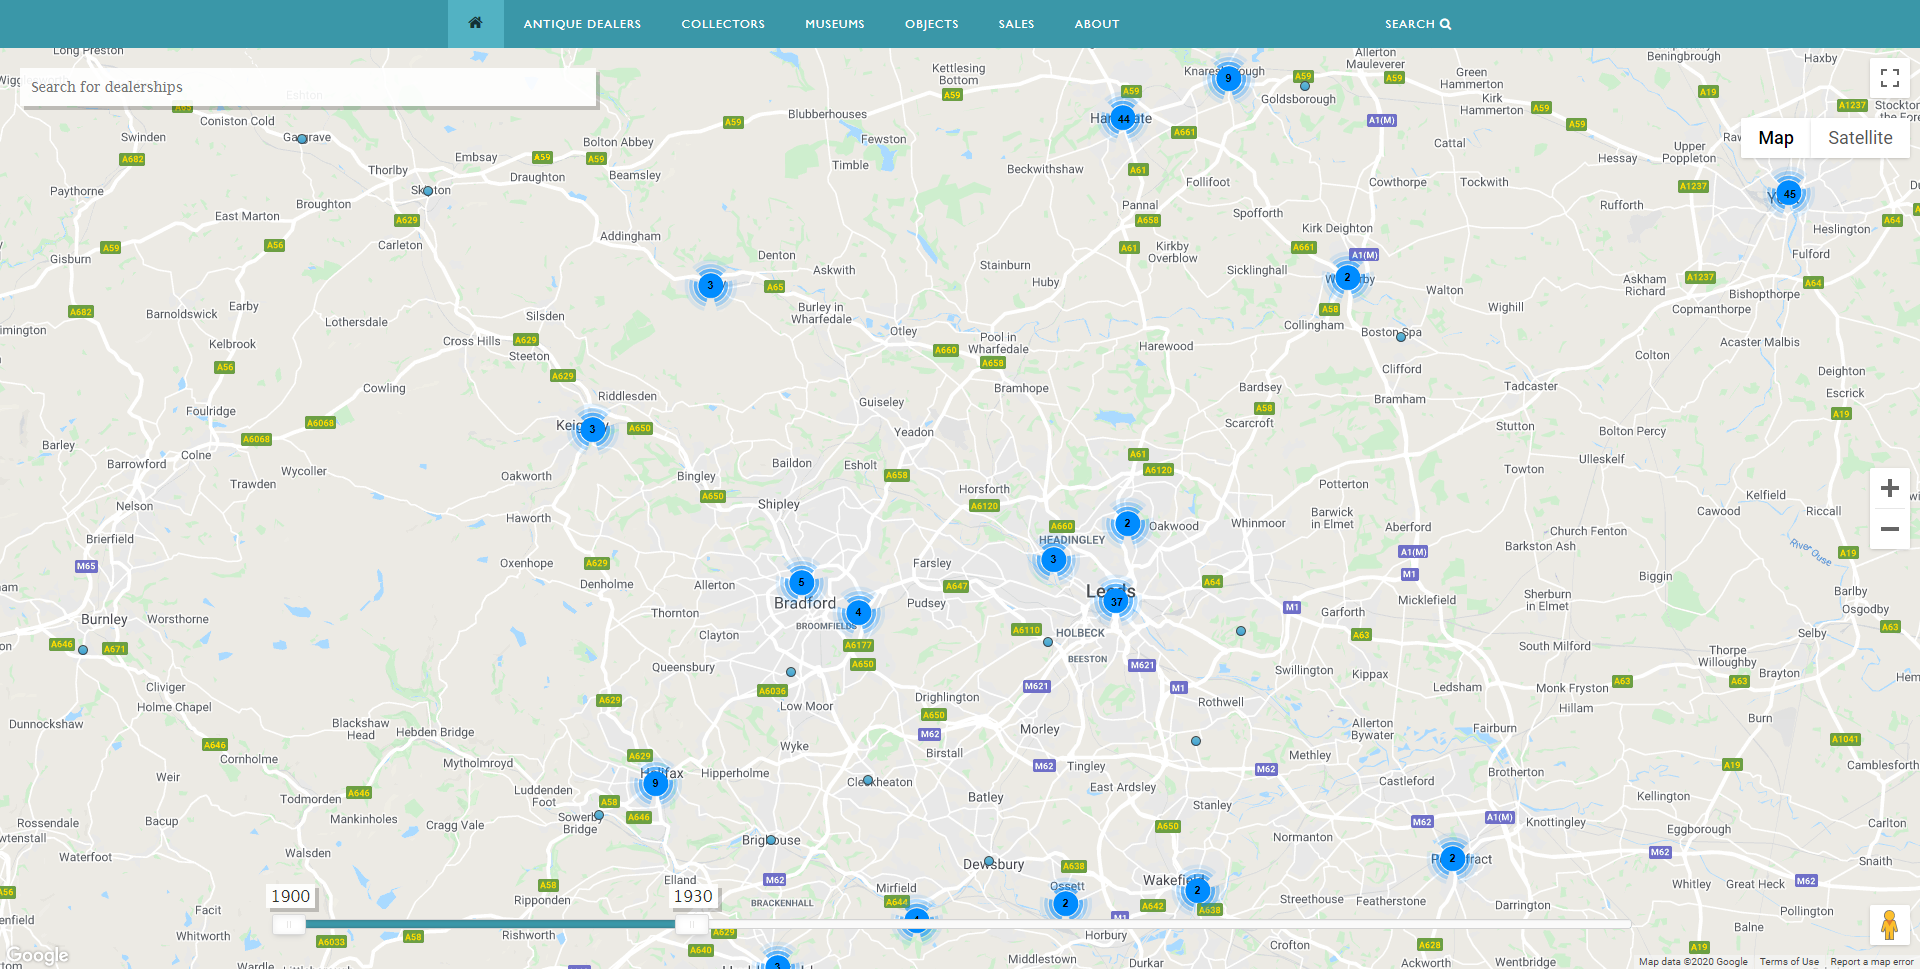
Antique Dealer Map – showing numbers of dealers in Yorkshire in 1900-1930. Image, Antique Dealers research project, University of Leeds.
In the Yorkshire region in the period 1900-2000 (below) (focused on dealer locations up to c.1970 again), the number of antique dealers in Harrogate has risen to 78; in York, to 63, and in Leeds to c.80. And the numbers of dealers in Knaresborough, Bradford and Halifax, have all increased to c.23 in each location. There is also a general increase in the number of dealers in the towns west and south of Leeds.
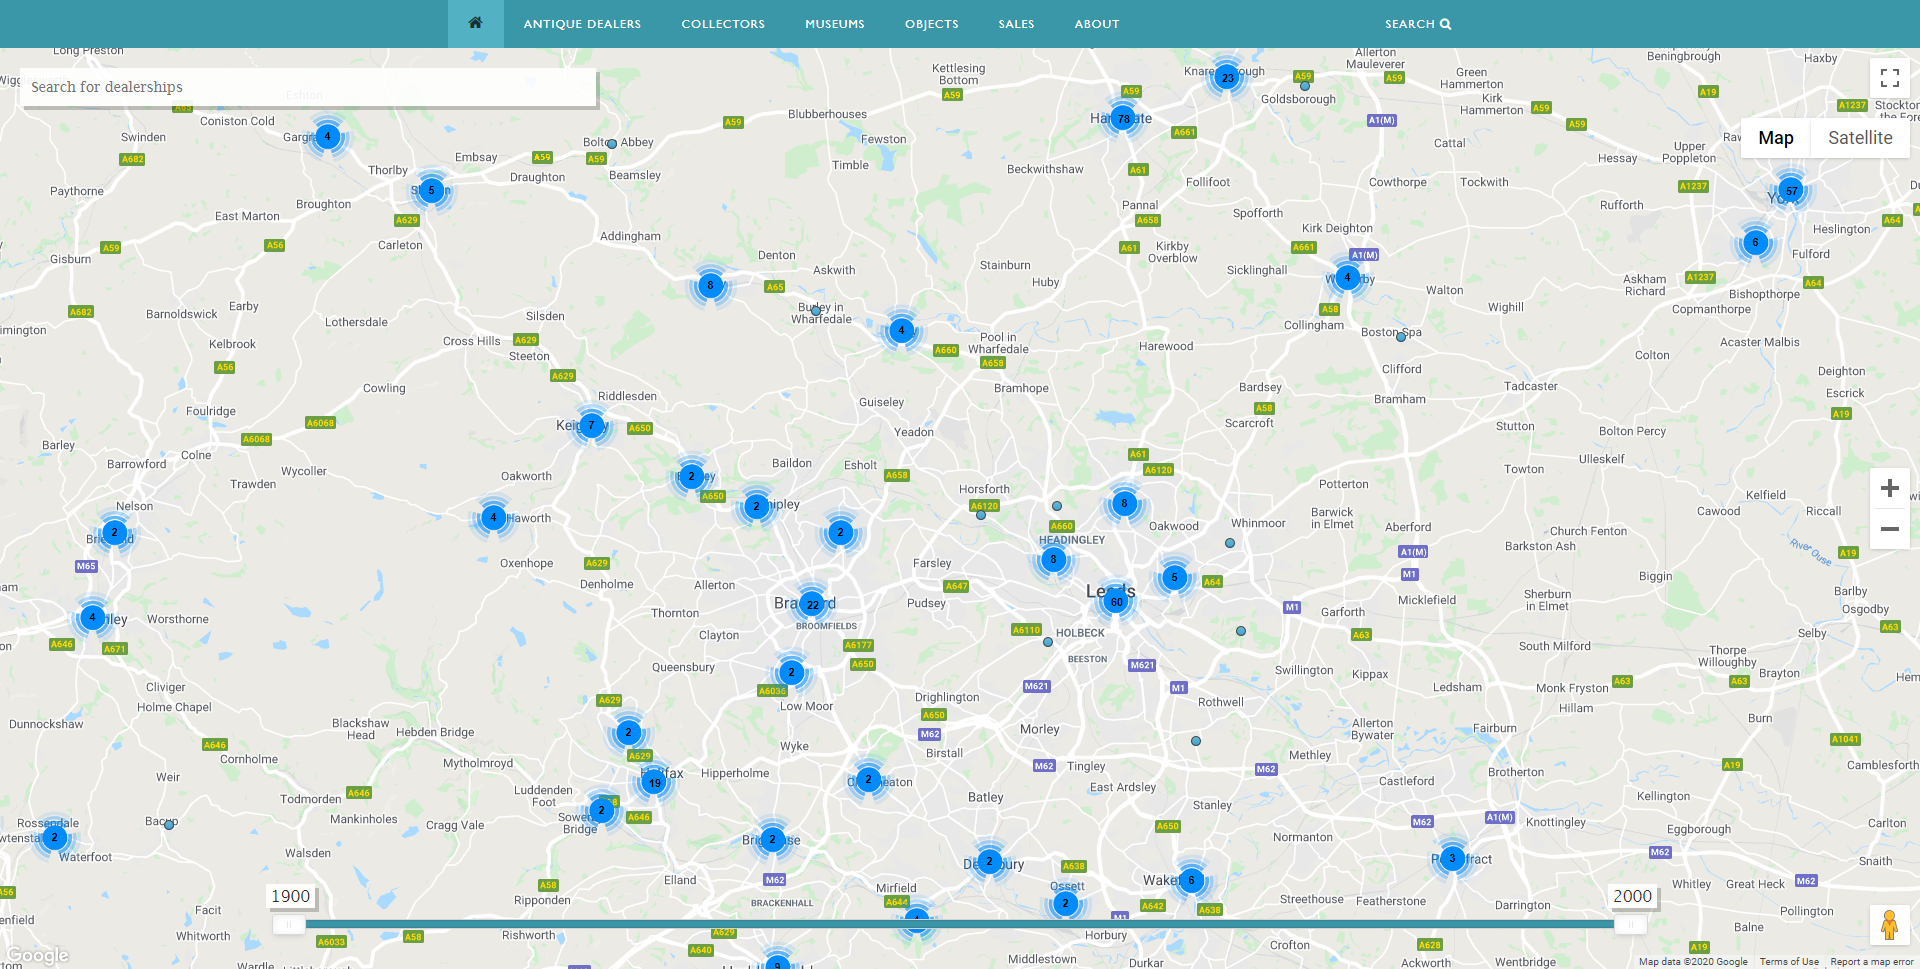
Antique Dealer Map – showing number of dealers in Yorkshire 1900-2000. Image, Antique Dealers research project, University of Leeds.
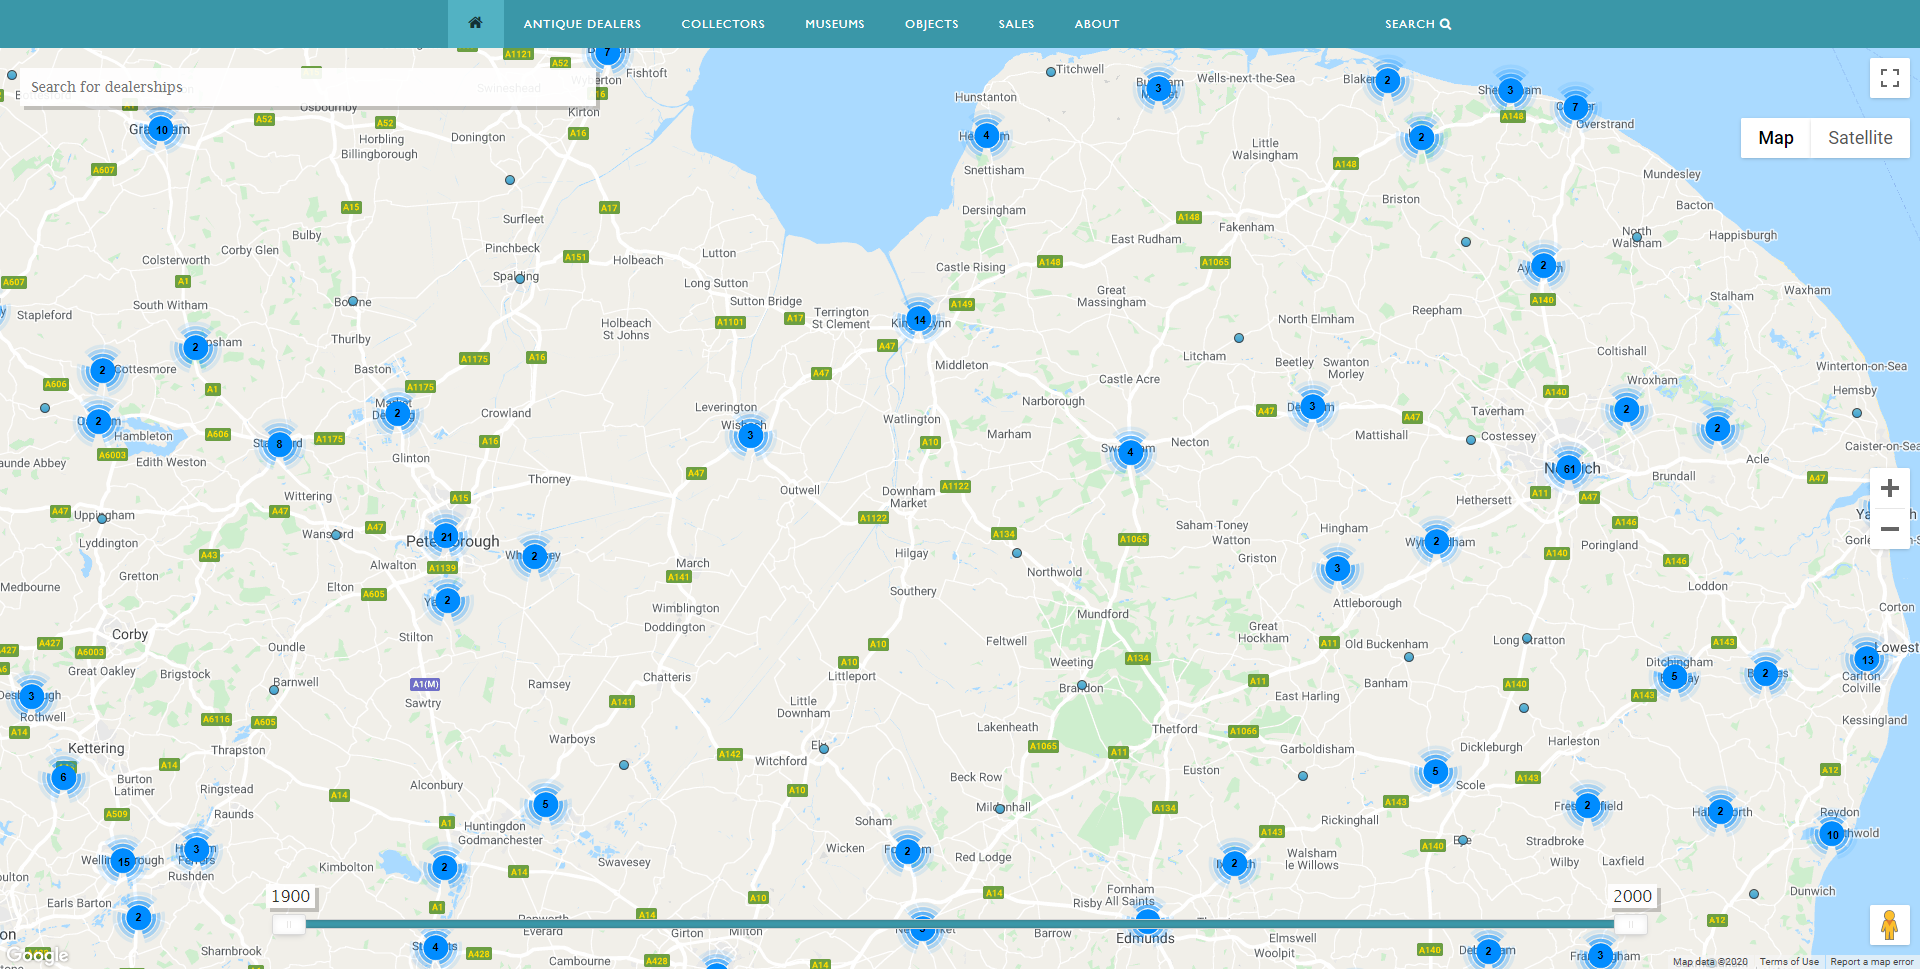
In the East Midlands of England, around the Norfolk and Suffolk areas, we see similar patterns of growth between 1930 and c.1970. In the map of 1900-1930 (see map below), the city of Norwich, again a location associated with tourism and with an important historic architectural fabric, had 39 antique dealers by 1930. And one can also notice a few locations on the north Norfolk coast with small numbers of dealers (Cromer, with 3 dealers for example). Indeed, further down the coast, into Suffolk, in the towns of Lowestoft (9 dealers) and Southwold (6 dealers), the presence of antique dealers illustrates the continuing legacy of tourism in the development of the antique trade. Further inland, the town of Bury St. Edmunds, again with a significant historic fabric, had 10 dealers in 1930. Inland further still, Peterborough was also an important location, attracting 17 dealers by 1930.
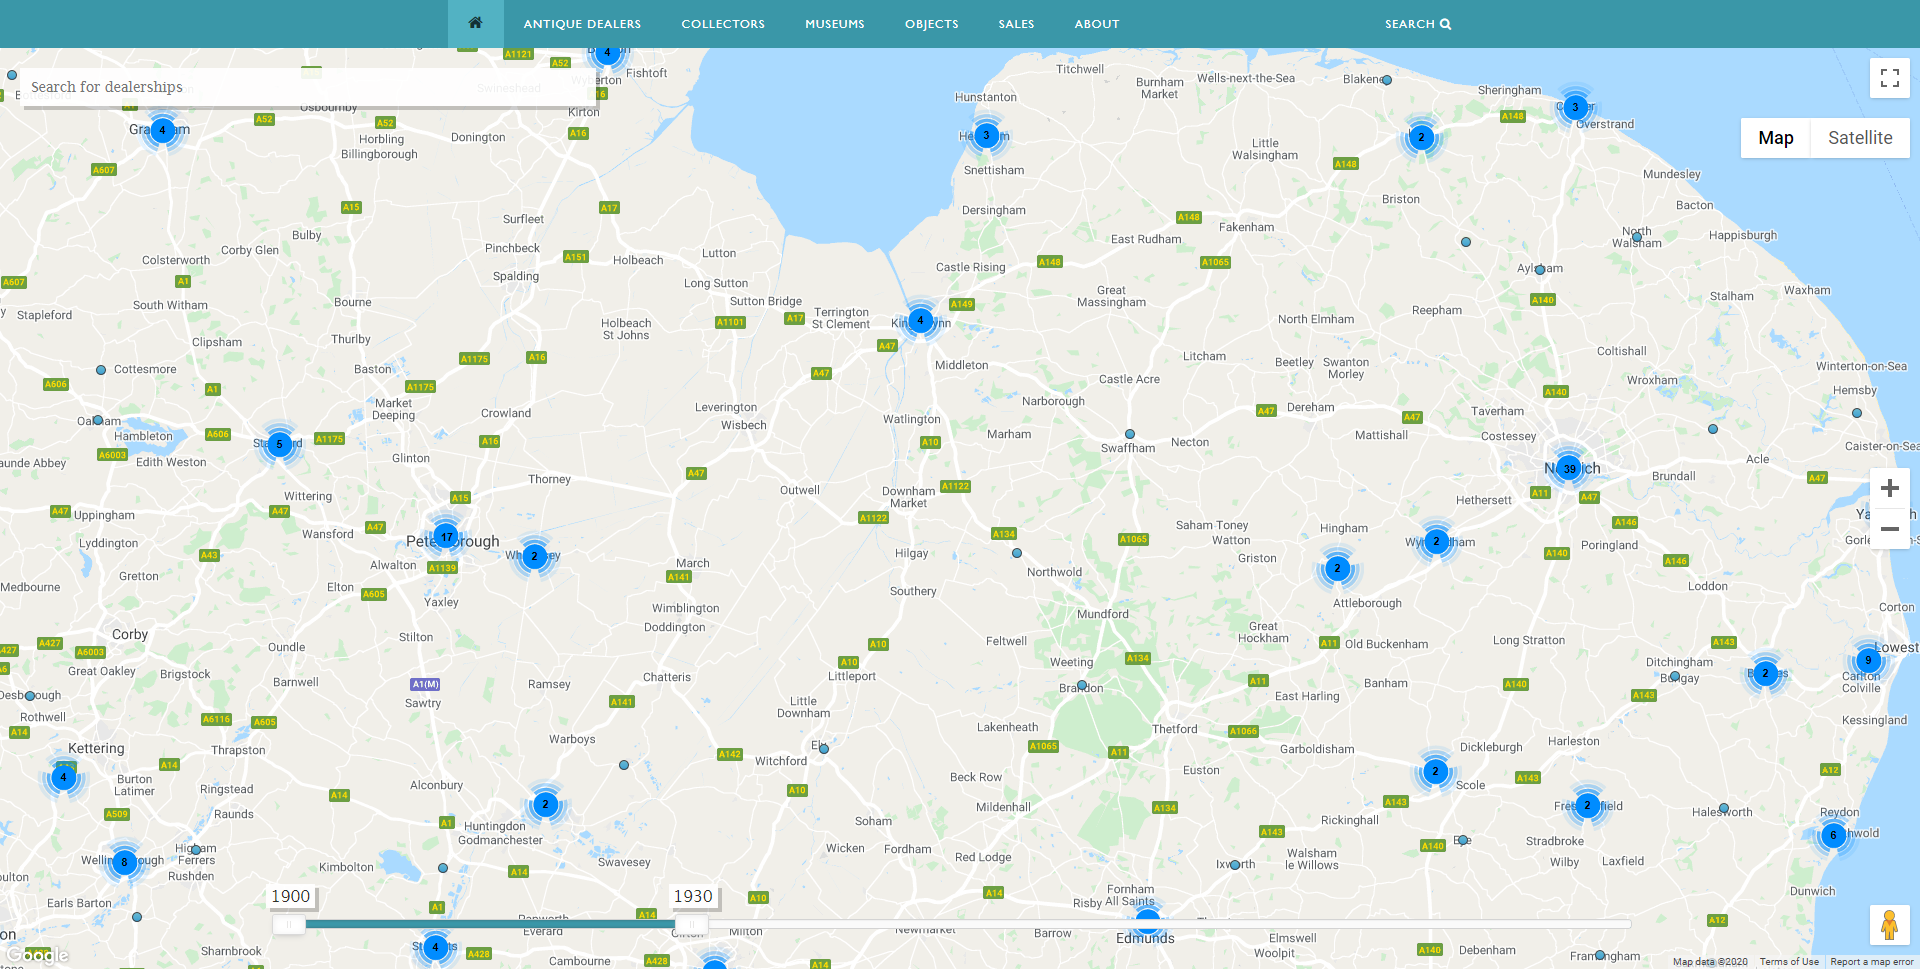
Antique Dealer Map – showing the locations of antique dealers in East Midlands 1900-1930. Image, Antique Dealers research project, University of Leeds.
Looking at the same locations in the map of 1900-2000, (focused on dealers up to c.1970) (see below), we can see some significant increases in the number of dealers in popular tourist locations.
Antique Dealer Map – showing numbers of dealers in East Midlands in the period 1900-1930. Image, Antique Dealers research project, University of Leeds.
In this map (above), the number of dealers based in Norwich has risen to 61 (from 39) by c.1970. And the coastal towns of north Norfolk have also seen a significant increase in the numbers of dealers – Cromer now has 7 dealers, and there are a number of other towns and villages on the north Norfolk coast that now have antique shops. The Suffolk coastal towns of Lowestoft and Southwold have also seen the numbers of dealers increase (Lowestoft has risen to 13; Southwold to 10). Bury St. Edmunds also has an increase in the number of dealers, rising to 25 dealers in c.1970, from 10 dealers in 1930. Further inland, in Peterborough, there has been a less significant rise in the number of dealers, increasing to 21 dealers in c.1970, from 17 dealers in 1930. But again, what is striking is the general increase in the number of locations that have attracted antique shops by c.1970, with dozens of villages across Norfolk and Suffolk being chosen as key locations by antique dealers.
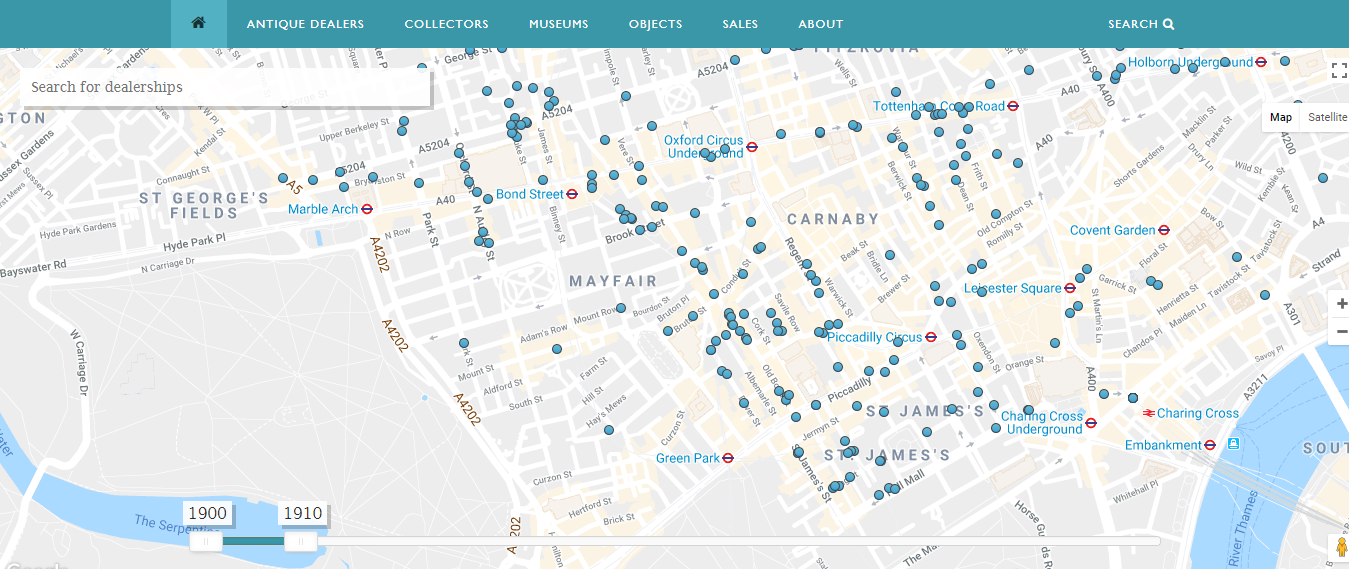
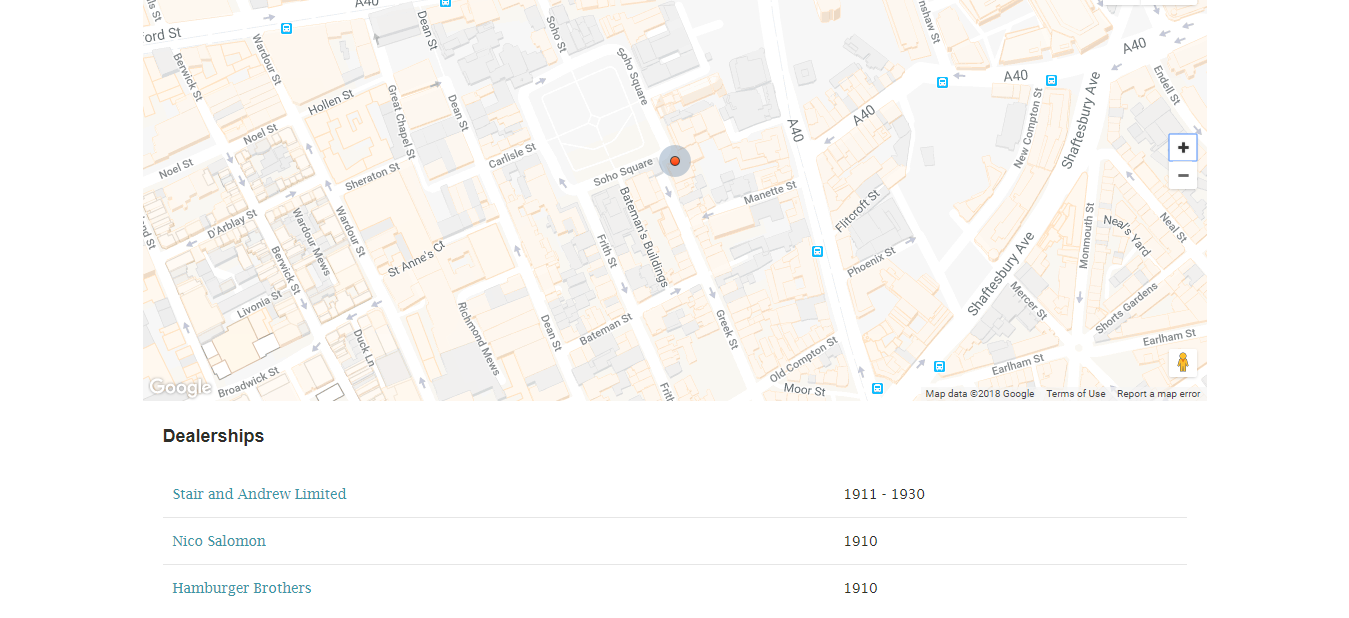
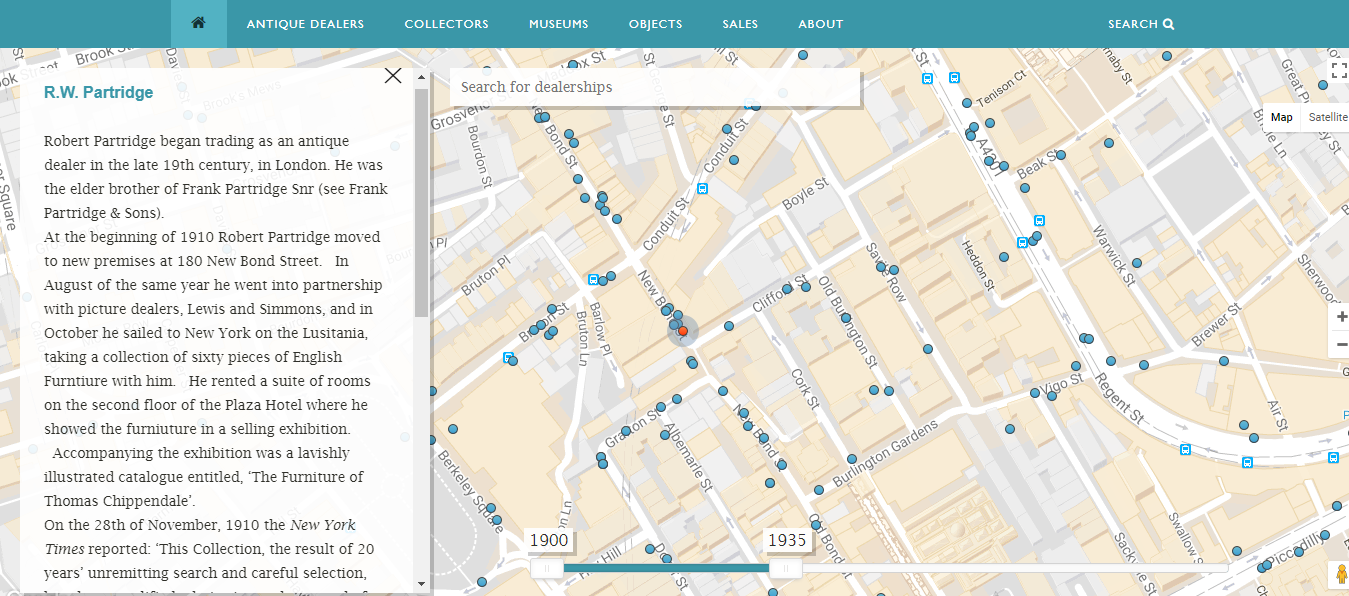
And finally, a look at the most important location for antique dealers in Britain – London. The map (below) shows the number of antique dealers across the capital in the period 1900-1930. Here, the West End of London dominates the landscape, with 826 dealers in 1930, followed by North London, with 236 dealers; then the Kensington area, with 224 dealers, and South West London (Fulham and Chelsea) with 213 dealers; and finally East London, with 70 dealers in 1930.
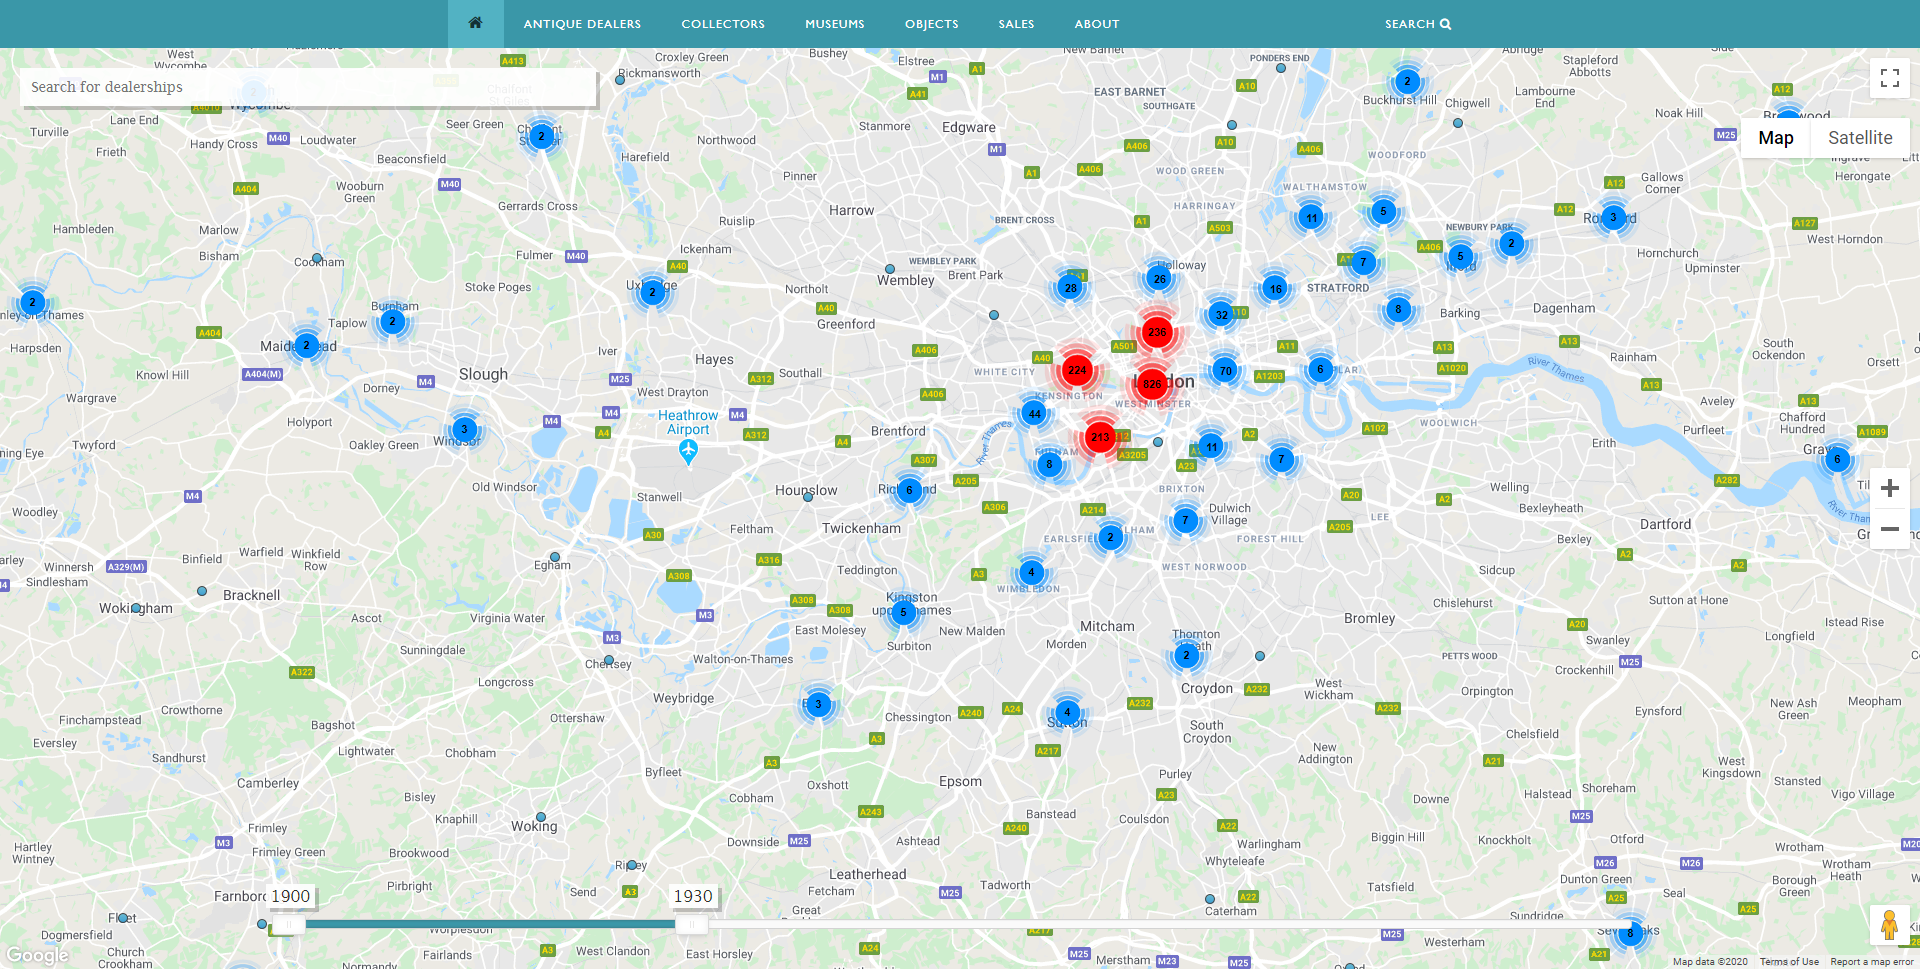
Antique Dealer Map – showing the numbers of dealers in London in 1900-200. Image, Antique Dealers research project, University of Leeds.
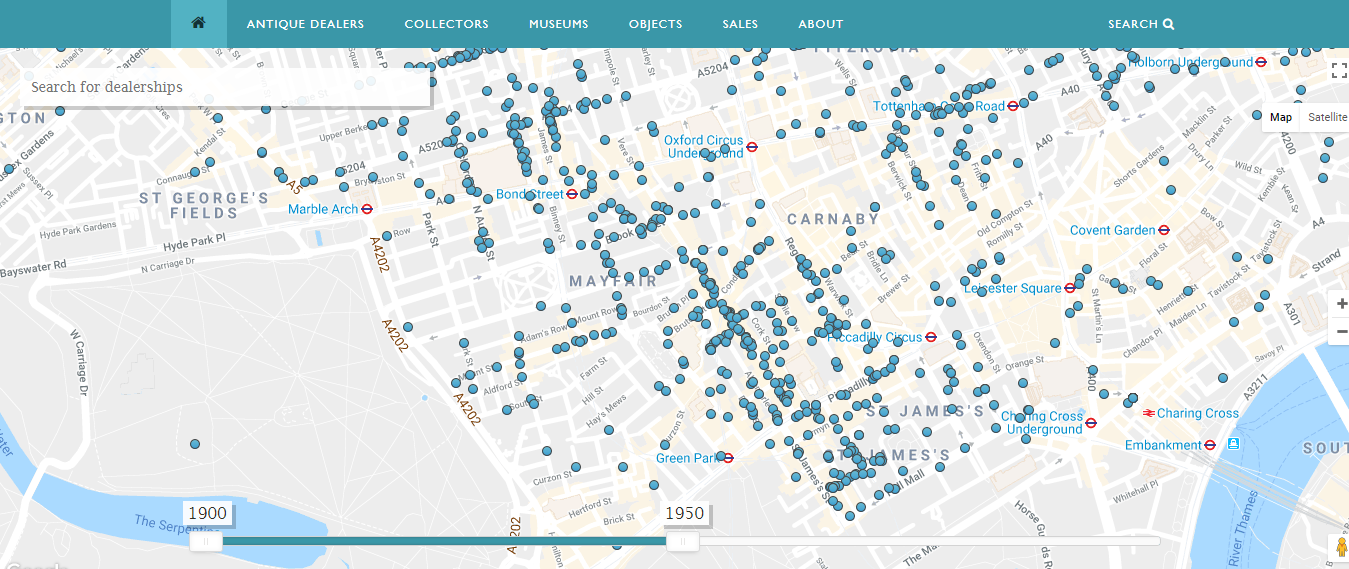
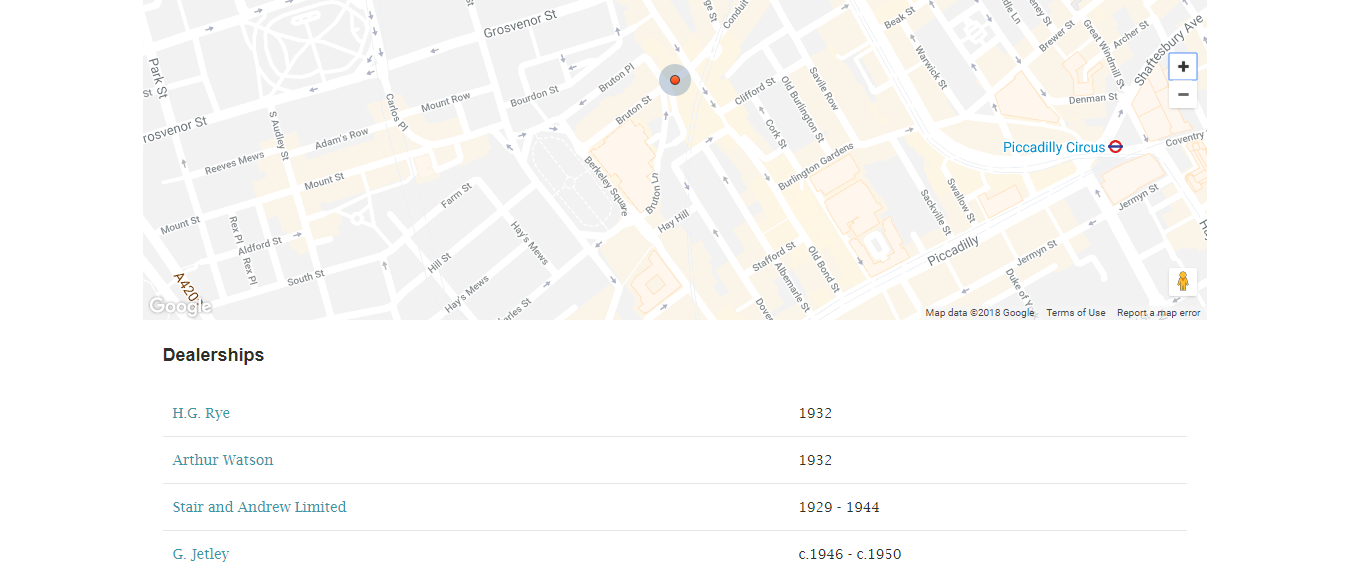
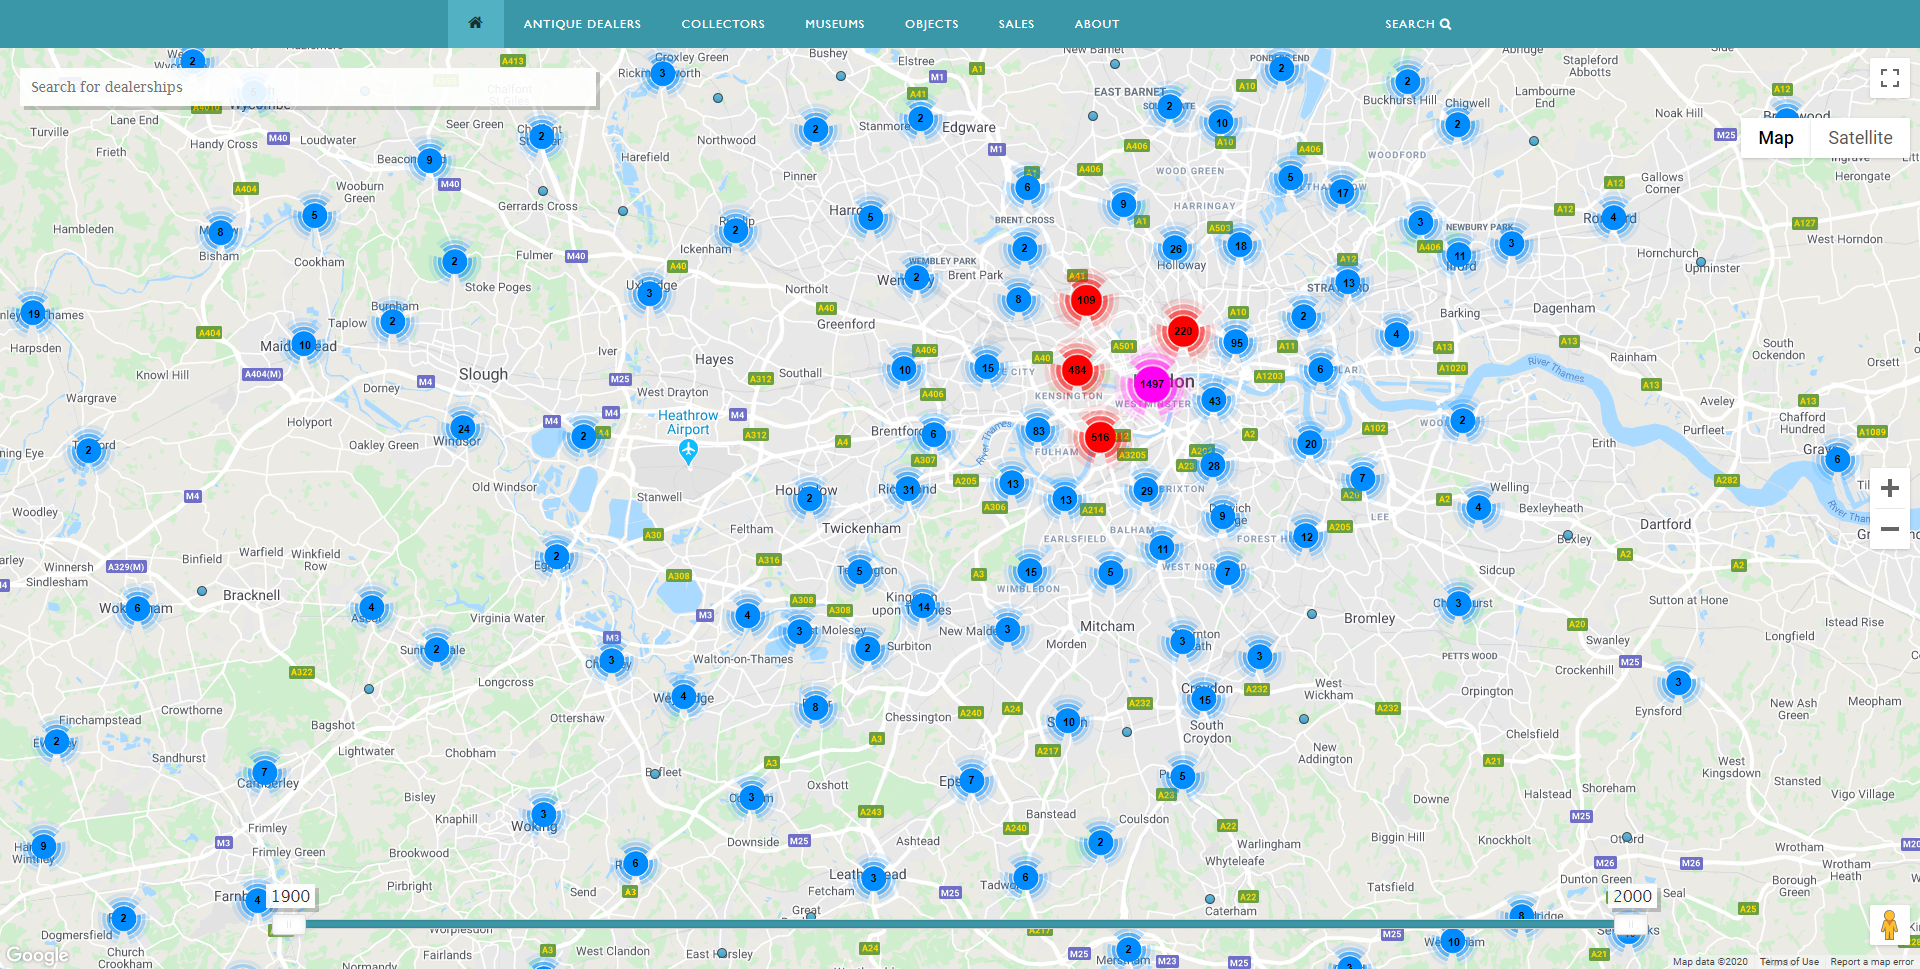
By c.1970, these already very high numbers of antique dealers (compared to anywhere else in Britain at least) had increased again, as this final map (below) of the same area illustrates. Here the numbers of antique dealers in the West End has risen to c.1500; in the North of London growth has remained virtually static though (220 dealers in c.1970); the Kensington area has seen a significant increase in the numbers of dealers, from 224 (in 1930) to 484 (in c.1970). But the biggest percentage increase of dealers in a single area in London appears to have taken place in South West London, in Fulham and Chelsea, which saw an increase in the numbers of dealers from 213 (in 1930) to 516 in c.1970. This area had some of the most high profile locations in the biography of the antique trade – Fulham Road, the King’s Road, and streets such as Beauchamp Place and Brompton Road.
There’s still a lot more to say about these changing geographies, and their significance, and still many more dealers to add into the map – there was a further expansion of the antique trade in the 1970s and 1980s, before the rapid contraction during the late 1990s, all of which we hope the Antique Dealer Map will illustrate. But I hope this brief overview demonstrates the rich potential of the Antique Dealer Map as a key resource in the ongoing research into the history of the antique trade in Britain.
Mark